CEAP Office of Assessment
By the Numbers
CEAP Enrollment - Spring 2024
|
Total Enrollment: 1771 Undergraduate: 1326 |
Race/Ethnicity |
Source: Tableau
Data Sources
WCU Public Data Dashboards - View data on enrolled students at WCU
NC DPI Educator Preparation Program Performance - View data on educator preparation across the state
Title II Data Reports - View public data on WCU and all other teacher education preparation programs in the US
CAEP Annual Reporting
Are our professional education students well prepared to make an impact in their career once they complete their programs? In a sense, this is the essential question of all our assessment efforts. See the sections below that present data on our graduates that address this question.
As our teacher and professional education programs are accredited through CAEP, we are required to submit an annual report and publicly present data on our programs. We encourage you to look through our data and analyses in each of the sections below.
This set of assessments aligns to CAEP Annual Report Measure 1: Completer Effectiveness (Component R4.1).
As of December, 2022 our state provides data on completer effectiveness in an online dashboard. To access the data for WCU, open the state's EPP Performance dashboard for Student Growth. This data is from the state's EVAAS system, a value-add model of teacher performance. The model uses end of subject/grade testing plus other data to determine if an individual teacher's students do not meet, meet, or exceed their expected growth in learning for that year, according to the model. In the list of all EPPs in the center of the page, click to highlight "WCU" in the list. This will filter all other data to display from WCU. The bar graph in the bottom left of the dashboard shows the ratings for recent WCU graduates (by calendar year of graduation). The graph in the top left indicates the percentage of candidates who meet or exceed expected student growth in each calendar year. For comparison, click on the highlighted WCU in the center graph to unselect it; this removes the filter and allows you to see the ratings for all beginning teachers in the state. For the years of data available (2019, 2022, and 2023), WCU has nearly the same percentage of recent graduates that meet or exceed expected growth compared to the average for the whole state. We also note that compared to state-wide data, our data are volatile, though generally averaging about the same level as the state as a whole. Given recent results are within previous ranges for our campus, we do not see an immediate need to react to the current data. However, this will be watched next year to see if the decrease in 2023 continues or if it seems to be a product of our typical volatility.
We last examined this data in April 2024; at that time the dashboard had data through calendar year 2023 and was last updated on 2/15/2024.
This set of assessments aligns to CAEP Annual Report Measure 1: Completer Effectiveness (Component R4.1).
As of December, 2022 our state provides data on teaching effectiveness in an online dashboard. To access the data for WCU, open the state's EPP Performance dashboard for Teaching Performance.
The graphs show data collected on beginning teachers (3 years of service or less) in public schools in North Carolina by the NC Educator Effectiveness System (NCEES). This system collects principal ratings of teachers on five key performance areas aligned to state teaching standards:
- Standard 1: Teachers Demonstrate Leadership ("LEADER")
- Standard 2: Teachers Establish a Respectful Environment for a Diverse Population of Students ("CLS ENV")
- Standard 3: Teachers Know the Content They Teach ("CONTENT")
- Standard 4: Teachers Facilitate Learning for Their Students ("PEDAGOGY")
- Standard 5: Teachers Reflect on Their Practice ("REFLECT")
In the list of all EPPs in the center of the page, click to highlight "WCU" in the list. This will filter all other data to display from WCU. You can select the year of data to display in the "Years to Display" selector near the top of the dashboard. The bar graph in the bottom left of the dashboard shows the most recent ratings for WCU graduates by standard for the selected calendar year(s). Note the codes in the list of standards above that correspond to this graph. The graph in the top left shows a percentage of all graduates that are rated proficient or higher by calendar year. For comparison, click on the highlighted WCU in the center graph to unselect it; this removes the filter and allows you to see the ratings for all beginning teachers in the state. For the most recent three calendar years of data available (2021 through 2023), WCU graduates are generally comparable to the percentage of those proficient or higher for the whole state. We note that in 2022, our percentage of beginning teachers rated proficient or higher dipped to 92%, lower than the previous year and lower than the state average. However, this recovered to our previous level in the following year and to once again be above averages in several years prior to the COVID pandemic. We will continue to monitor this but do not see a negative trend we need to respond to.
We last examined this data in April 2024; at that time the dashboard had data through calendar year 2023 and was updated on 2/27/2024.
This set of assessments aligns to CAEP Annual Report Measure 2: Satisfaction of employers and stakeholder involvement (Components R4.2, R5.3, RA 4.1).
As of December, 2022 our state provides data on employer satisfaction in an online dashboard. To access the data for WCU, open the state's EPP Performance dashboard for Employer Satisfaction with Preparation. The NC Employer Survey has been developed by the North Carolina Department of Public Instruction and the Education Policy Initiative at Carolina (EPIC). The survey requires NC principals or assistant principals to rate all beginning teachers on 35 items that are aligned to the state's five professional teaching standards. In the list of all EPPs in the center of the page, click to highlight "WCU" in the list. This will filter all other data to display from WCU. You can select the year of data to display in the "Years to Display" selector near the top of the dashboard. For comparison, click on the highlighted WCU in the center graph to unselect it; this removes the filter and allows you to see the ratings for all beginning teachers in the state. The "By Response" graph in the center left of the dashboard shows the overall effectiveness rating for WCU graduates compared to other beginning teachers averaged over the years included. The "By Survey Year" graph in the top left indicates what percentage of beginning teachers from WCU were rated as comparable to or more effective than their peers. For the three most recent years of data available (2021 thorugh 2023), WCU graduates are rated comparably to completers of all EPPs. We note that the percentage of WCU graduates who performed comprably or better than peers dropped slightly in 2022 then increased in 2023 but not as high as 2021. However, this same pattern applies to all beginning teachers across the state. We conclude that there may be forces outside our control involved. This data still seems to indicate the strength of our program as seen by employers and does not call for immediate action.
We last examined this data in April 2024; at that time the dashboard had data through calendar year 2023 and was updated 3/4/2024.
This set of assessments aligns to CAEP Annual Report Measure 2: Satisfaction of employers and stakeholder involvement (Components R4.2, R5.3, RA 4.1).
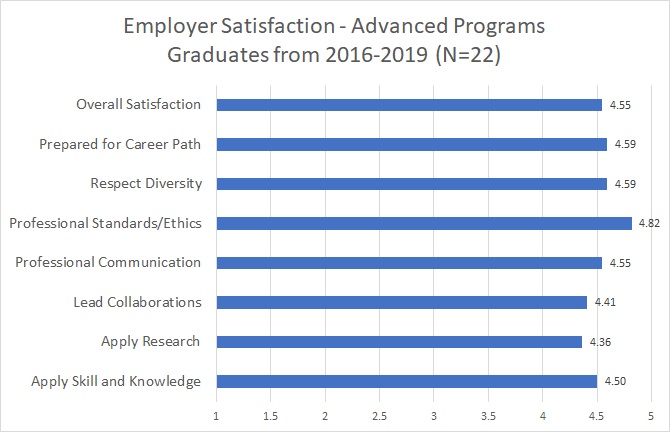
In the 2019-2020 academic year, our advanced programs piloted a survey of the satisfaction of employers with our recent graduates (graduates in the range 2016-2019) they have hired. Questions were modified to be specific to programs, but aggregated by general concept. Results from our first administration of this survey are presented below. Note that this set of surveys has not been validated as this pilot is being reviewed by our faculty for revision. Our phase-in plans for advanced programs include validating the surveys used and establishing a regular schedule to collect them. These results indicate employers are overall satisfied with our recent graduates. These data do not indicate a clear area of weakness to address.
This graph includes the MAED, MSA, and EdD programs.
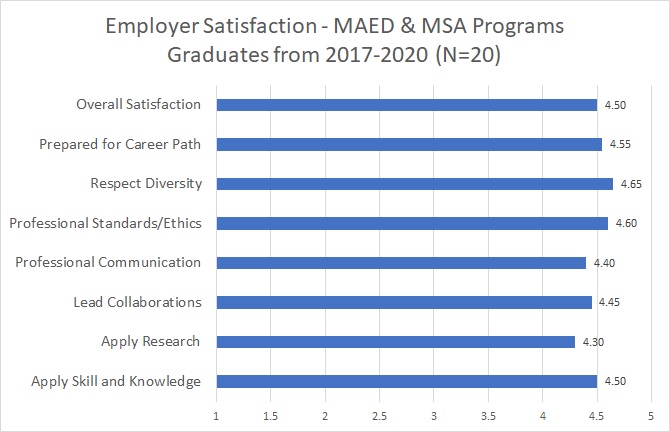
 This graph includes the MAED and MSA programs. The EdD program is revising their instrument.
The SSP in School Psychology program is one of our advanced programs but had a low response rate with their initial survey, so we are not able to present these publicly. We did not collect this data during the COVID pandemic.
New Survey Schedule
As of Spring 2023, we made a new schedule for collecting employer satisfaction data. Our programs do not have large numbers of graduates, so to prevent survey fatigue we have designated a cycle of three years over which we survey employers of each program's graduates once over that three year period. Our schedule is:
- Year 1 - MAED Comprehensive Education
- Year 2 - MSA School Administration and EdD in Educational Leadership (combined)
- Year 3 - SSP School Psychology
In addition, in the first year for each program in our cycle, we are reviewing the program's survey against the new CAEP survey criteria to ensure compliance.
We begin this cycle in spring 2023 as "year 1" in the cycle. We reviewed the survey used for the MAEd program. We decided to revise it and the piloted it as required to ensure it meets the new CAEP criterial. In that spring, we also surveyed the employers of graduates of our MAED program who have graduated in academic year 2019-2020, 2020-2021, and 2021-2022. Results from this survey are shown in the following graph. Employers were asked to rate each item on a Likert scale where 5 = Strongly Agree, 4 = Agree, 3= Neither agree nor disagree, 2 = Disagree, and 1 = Strongly Disagree.
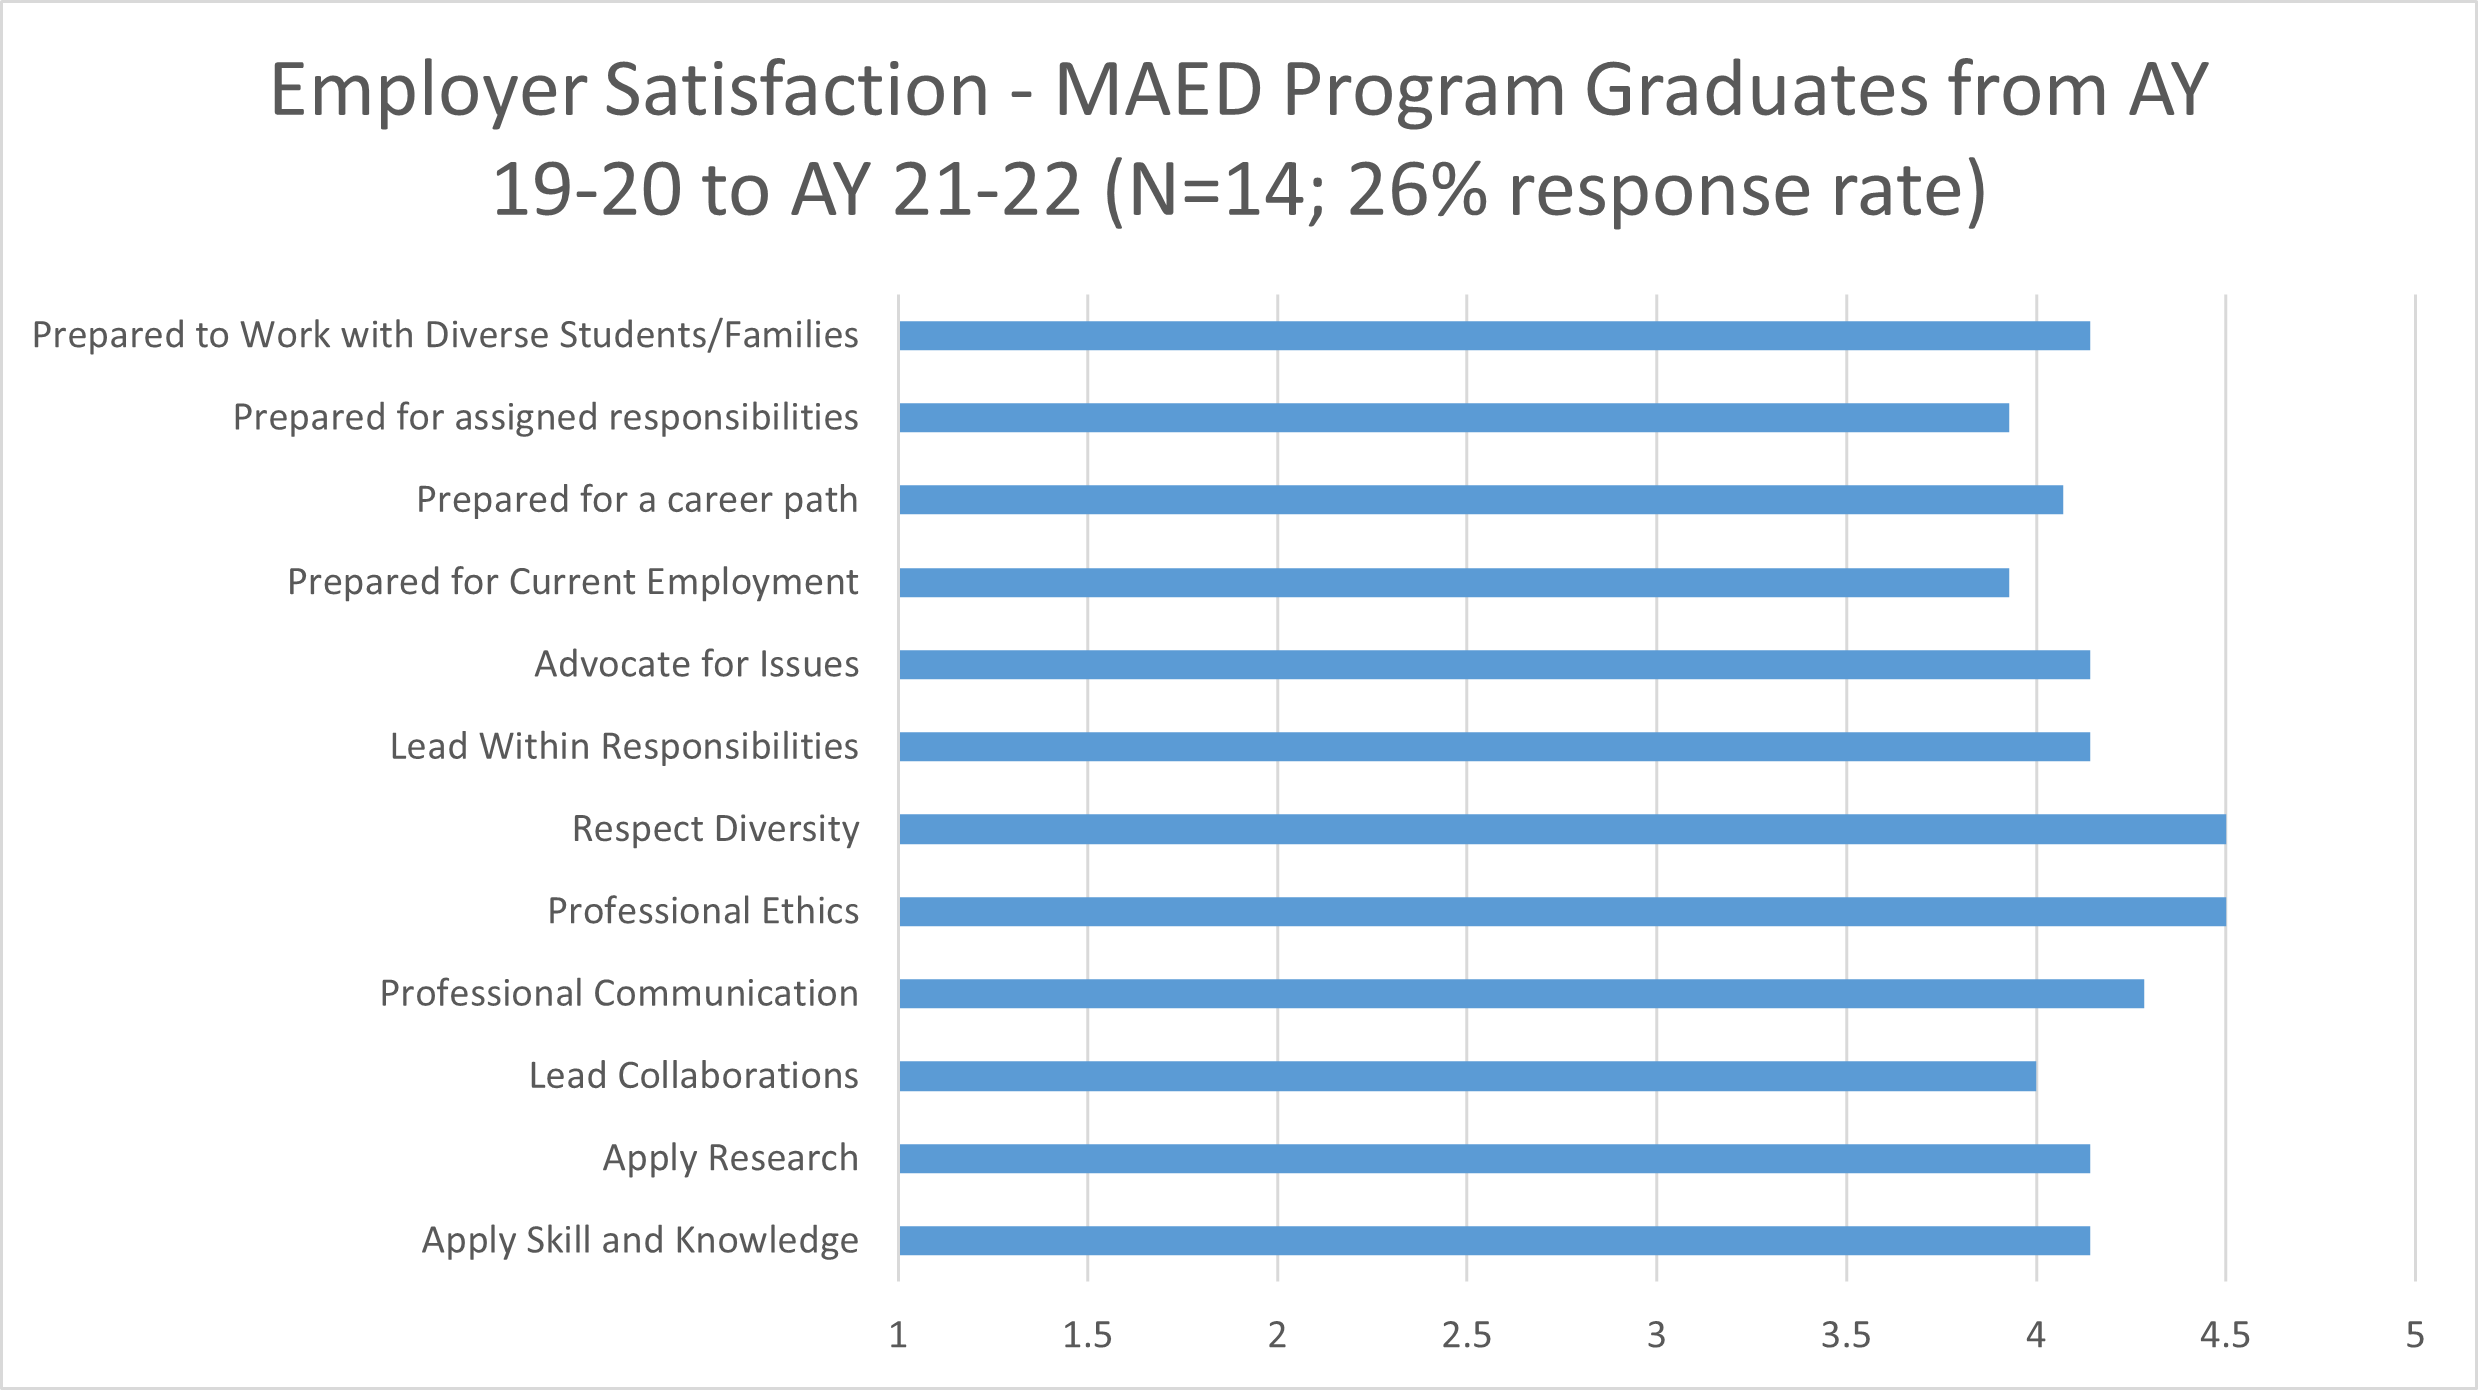 Results indicate that on most items, the average ratings are "Agree" or higher. The
two items below "Agree" are both rated an average of 3.9. These do not lead us to
concern over these items, but we note that these issues of preparation for current
employment in general and particular assigned responsibilities. We will review these
results with the program at our fall program assessment meeting.
Results indicate that on most items, the average ratings are "Agree" or higher. The
two items below "Agree" are both rated an average of 3.9. These do not lead us to
concern over these items, but we note that these issues of preparation for current
employment in general and particular assigned responsibilities. We will review these
results with the program at our fall program assessment meeting.
As per schedule, in Spring 2024, we surveyed employers of graduates of our MSA and EdD programs. Through data available from our state, we identified the employers of graduates of our MSA and EdD programs who graduated in academic year 2020-2021, 2021-2022, and 2022-2023. Results from this survey are shown in the following graph. Employers were asked to rate each item on a Likert scale where 5 = Strongly Agree, 4 = Agree, 3= Neither agree nor disagree, 2 = Disagree, and 1 = Strongly Disagree.
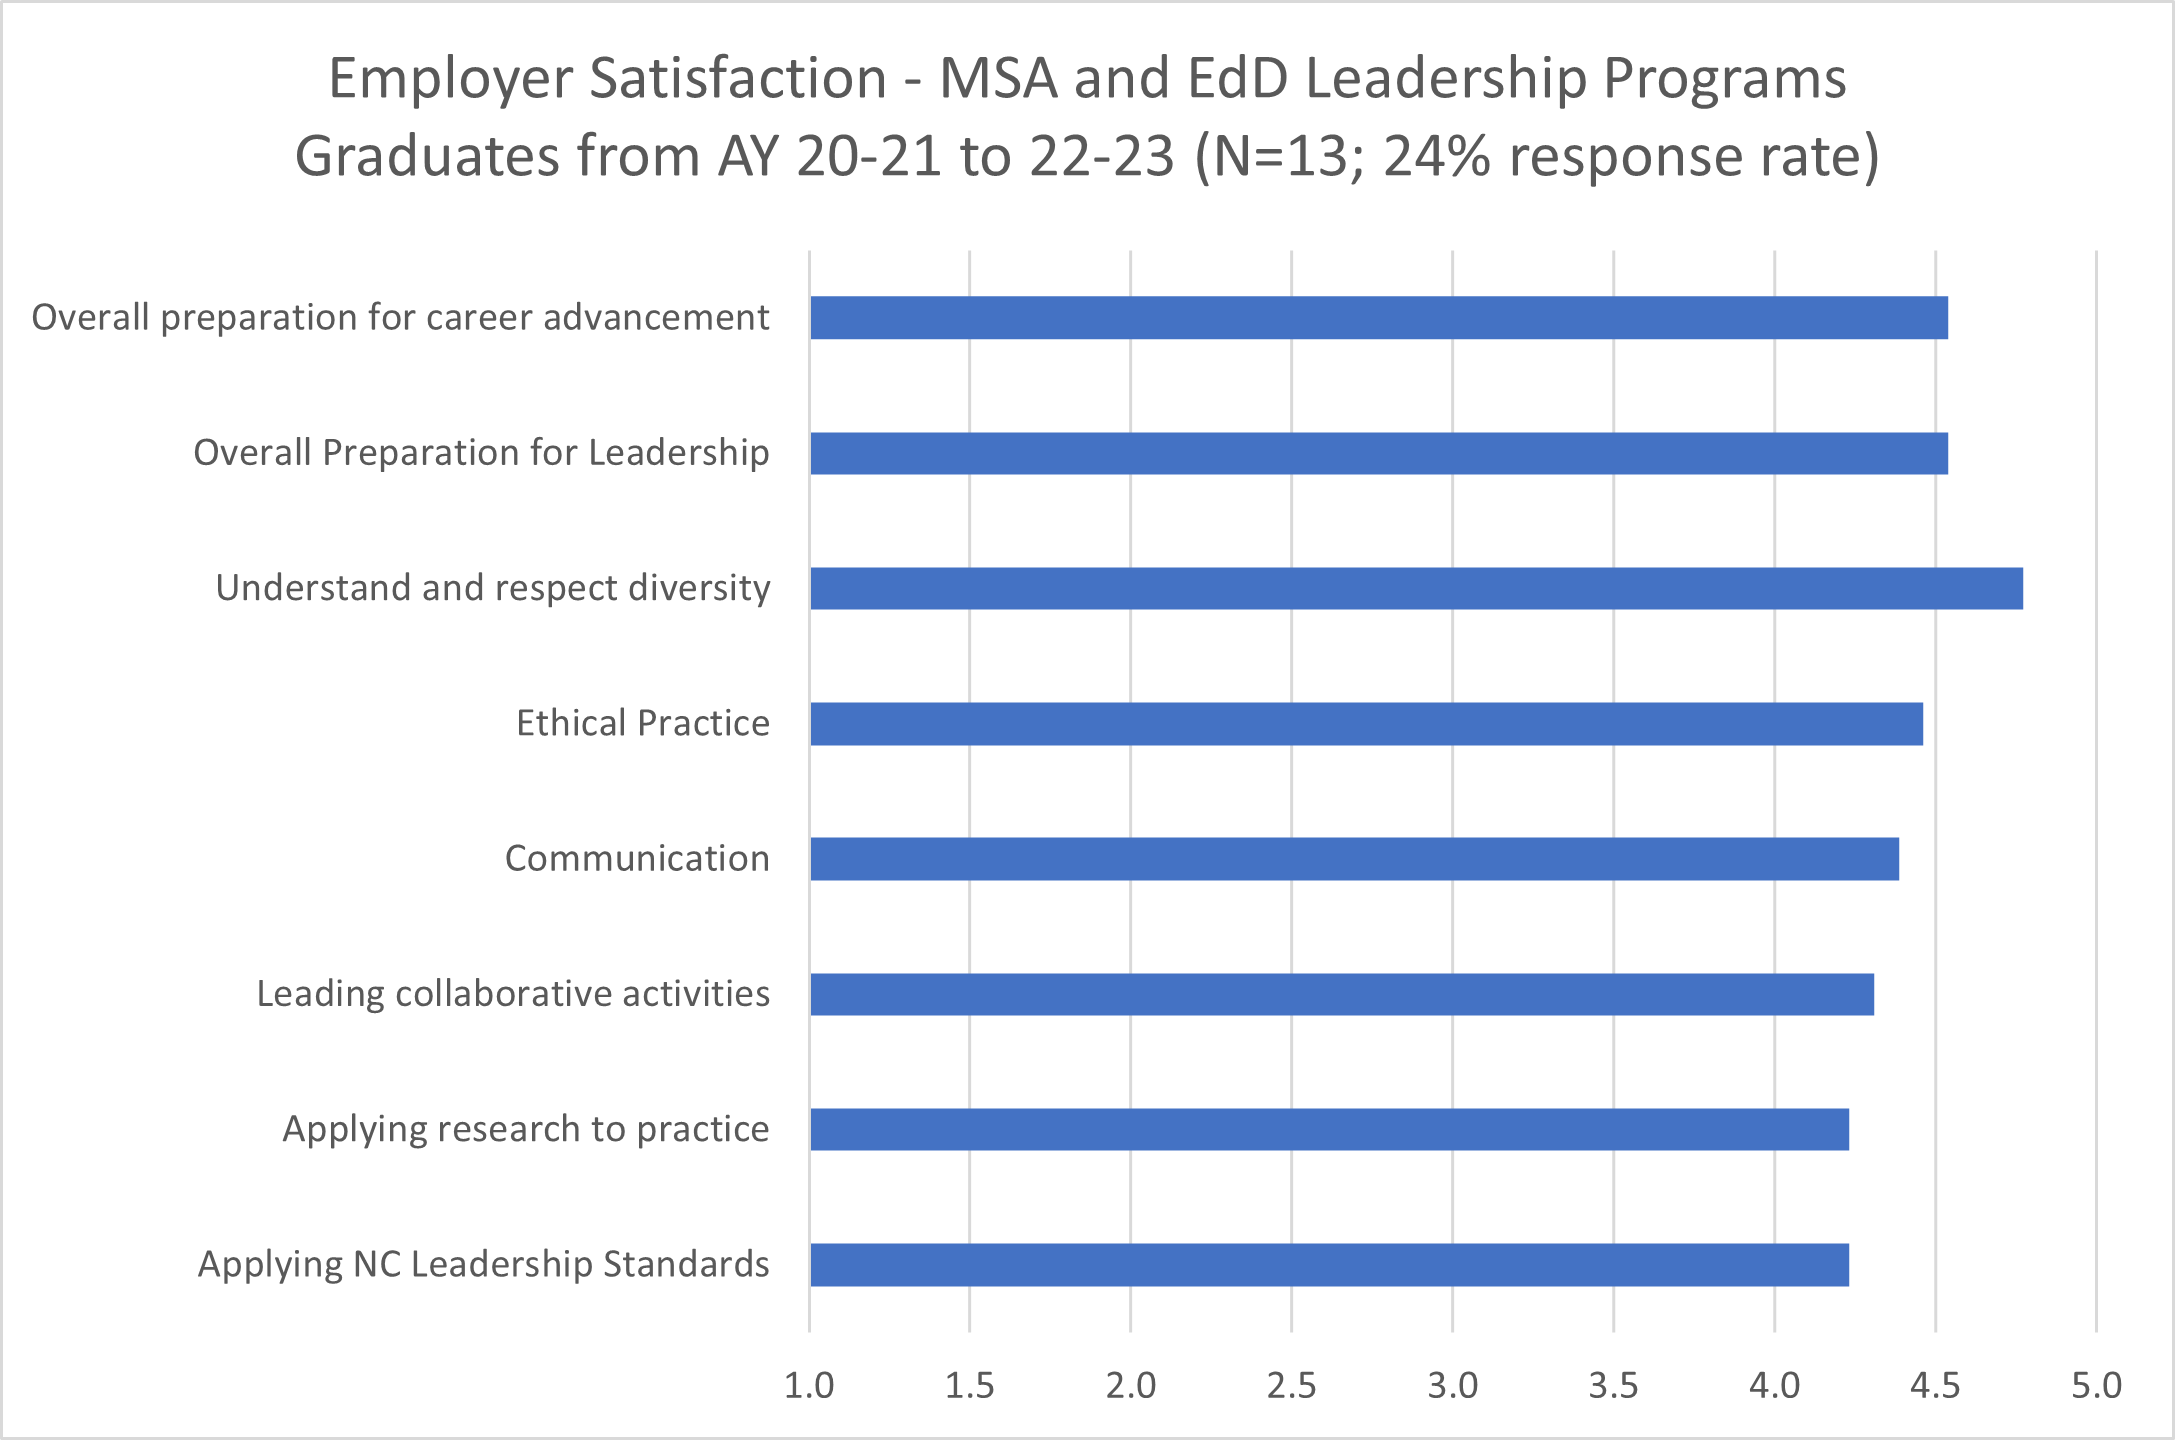 Results indicate that on all items the average ratings are "Agree" or higher. We consider
this to show employers of graduates in these programs are well satisfied with their
preparation.
Results indicate that on all items the average ratings are "Agree" or higher. We consider
this to show employers of graduates in these programs are well satisfied with their
preparation.
The advanced program data presented here is the most recent data available as of April 2024.
Data Source(s): Internal data collection/analysis
This set of assessments aligns to CAEP Annual Report Measure 3: Candidate competency at completion (Component R3.3), specifically for initial level programs.
Our initial level programs use multiple measures to determine if our teacher candidates are ready for the profession. See the following links and data tables for a summary of this data.
Licensure Exams
Our candidates must successfully pass one or more standardized exams to qualify for a North Carolina teaching license. The NC Department of Public Instruction maintains a data dashboard that allows you to examine performance on licensure exams. In the list of all EPPs in the center of the page, click to highlight "WCU" in the list. This will filter all other data to display from WCU. You can select the year of data to display in the "Years to Display" selector near the top of the dashboard. For comparison, click on the highlighted WCU in the center graph to unselect it; this removes the filter and allows you to see the ratings for all beginning teachers in the state. The graph on top right indicates an overall pass rate based on all attempts on all exams. For the three most recent years of data (2021 through 2023), WCU's pass rates are higher or comparable to those of all EPPs. In the top left, you can select test types to consider data by those categories. We will continue to monitor these results, but are overall satisfied with our candidate's performance compared to our peers.
We last examined this data in March 2024; at that time the dashboard had data through calendar year 2023.
edTPA
edTPA is an assessment of teacher education candidates’ skills in planning instruction, conducting instruction, and assessment of student learning. It is a nationally used assessment and is scored by professional educators external to WCU. Attempting the edTPA assessment is required for all teacher candidates and passing it is a requirement for a North Carolina teaching license. The graphs below present our recent edTPA results. Note that in North Carolina, candidates pass edTPA with a score of 38 or higher.
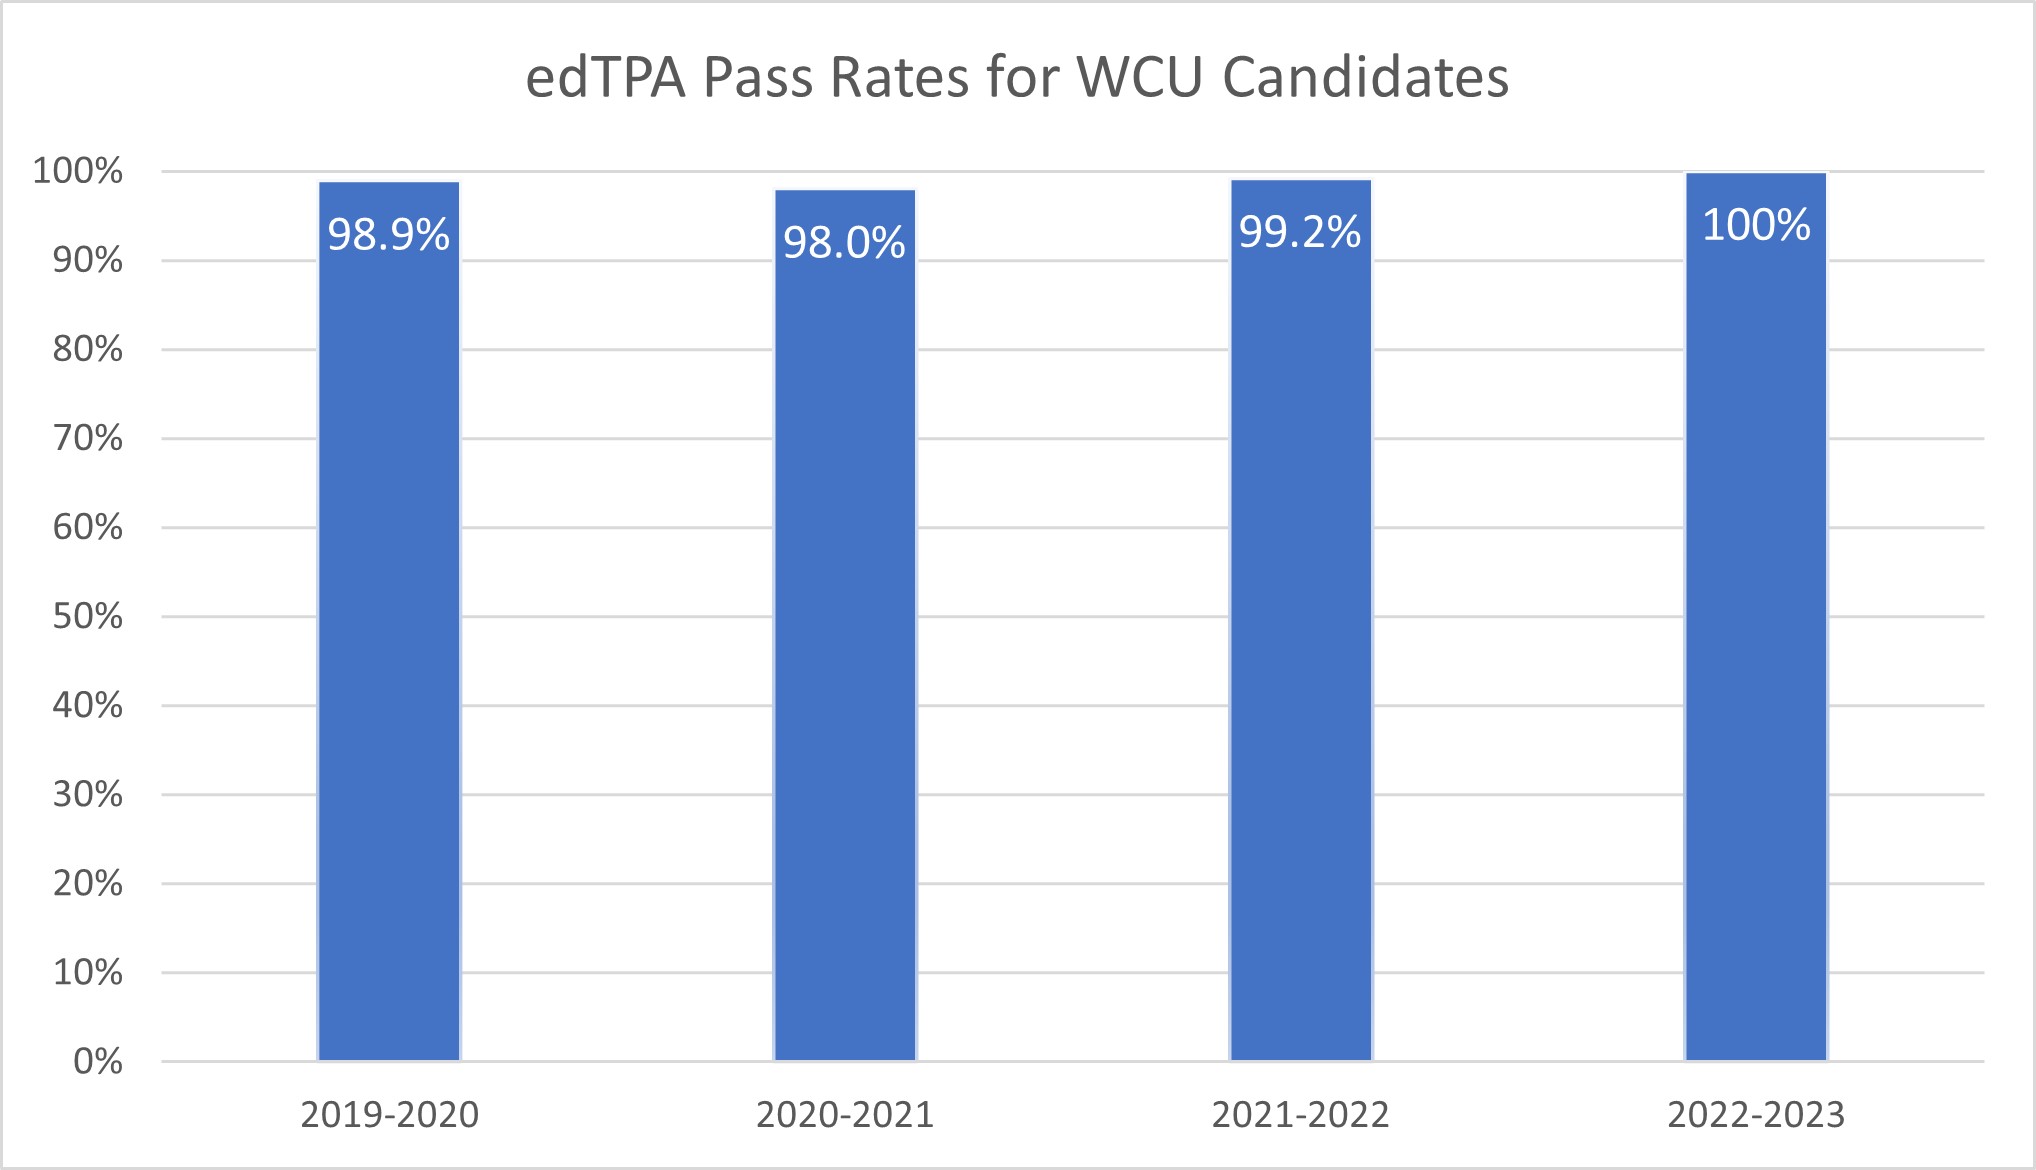
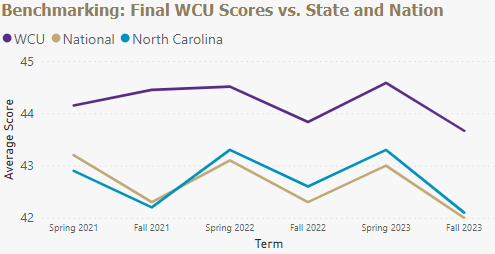
As seen in the graphs, our pass rates are high - close to 100% for the years of data available. Also, our average candidate scores are consistently higher than the average scores of all candidates in the state and nation. We consider these positive outcomes and demonstrate the value of our programs in preparing candidates for their professional career in teaching.
These data are current as of April 2024 and include results through our Fall 2023 cohort of graduates.
Certification of Teaching Capacity (CTC)
The Certification of Teaching Capacity (CTC) is an assessment of teacher education candidate’s capacity to teach according to the NC state teaching standards. This is assessed near the end of each candidates' Intern II experience. The assessment is aligned to the NC Teaching Standards:
- Teachers Demonstrate Leadership
- Teachers Establish a Respectful Environment for a Diverse Population of Students
- Teachers Know the Content They Teach
- Teachers Facilitate Learning for Their Students
- Teachers Reflect on Their Practice
The graph below presents our recent CTC results. Note that candidates are required to rate a 3 or higher on all items on the CTC in order to be recommended for a license in North Carolina.
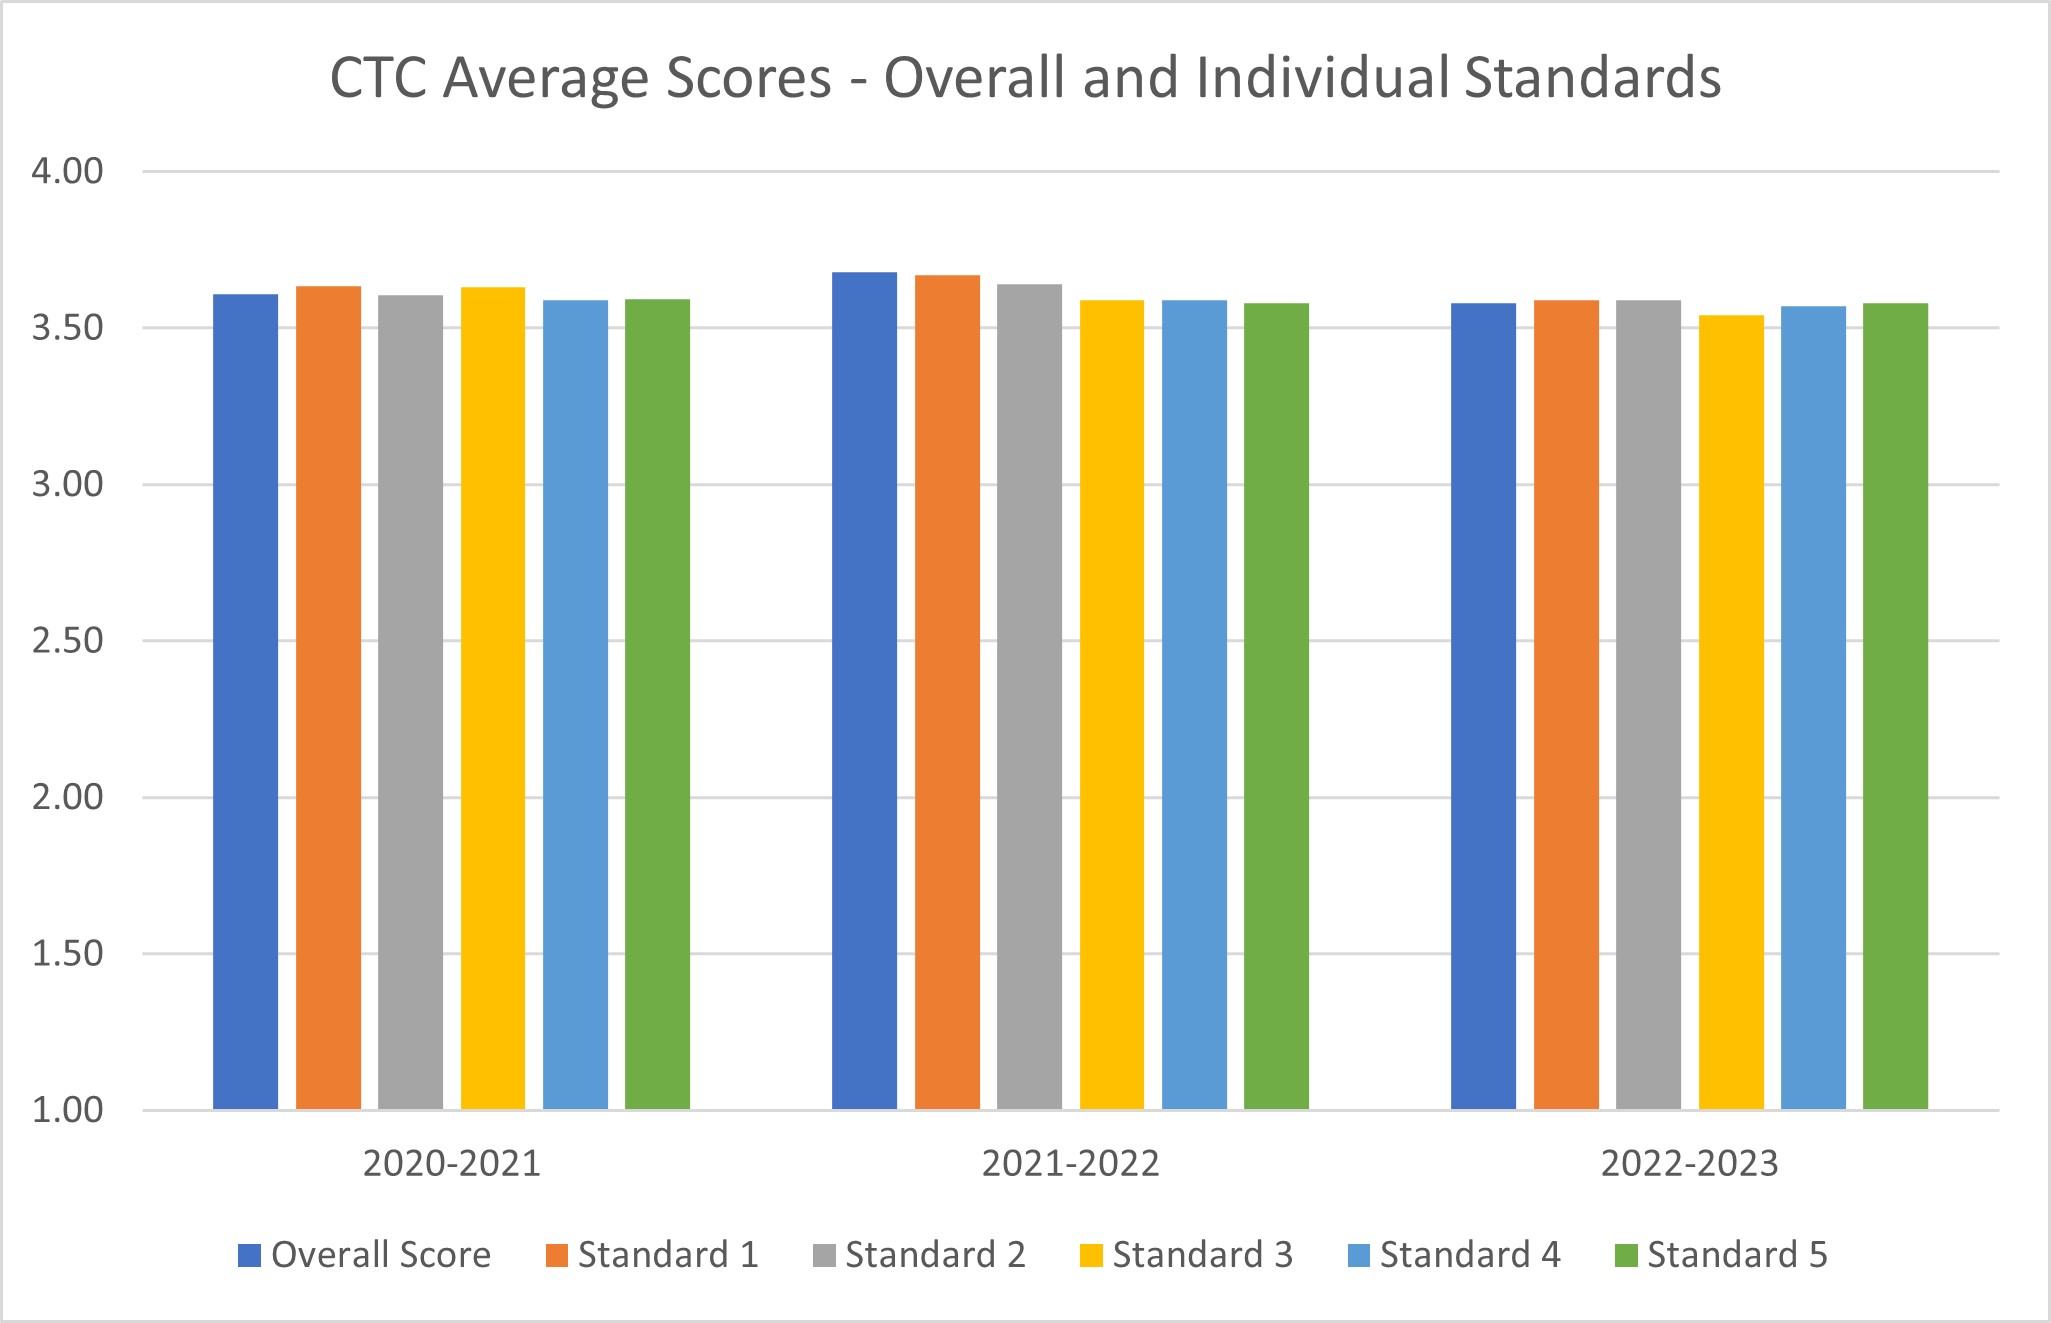 As seen in the graph, the average overall score and averages for ratings on each standard
are all 3.5 or higher for candidates in all three years. We consider this to indicate
a strong indicator of the quality of our candidates according to our state standards.
As seen in the graph, the average overall score and averages for ratings on each standard
are all 3.5 or higher for candidates in all three years. We consider this to indicate
a strong indicator of the quality of our candidates according to our state standards.
As we present data by academic year, these data are current as of April 2024.
Educator Dispositions Assessment (EDA)
The Educator Disposition Assessment (EDA) is designed to assess dispositions of teacher education candidates as they progress through an academic program. The EDA consists of a nine-item rubric that is used to rate candidates on a scale of 0 (Need Improvement), 1 (Developing), and 2 (Meets Expectations). The EDA was created by researchers at Florida International University based on current dispositions research and aligned to the InTASC standards.
We assess candidates with the EDA at three gateways: entry to the program (at the time of admission to teacher education), at a midpoint (when they are applying for their year long internship), and at the endpoint (the final semester of internship). In the graphs below, these do not follow cohorts. They are the average disposition scores of all candidates going through that gateway in that academic year. Our expectation is that there will be a stairstep pattern of scores with entry at the lowest point and endpoint at the highest. We also expect that candidate scores will be at or very close to a 2 (Meets Expectations) by the endpoint gateway.
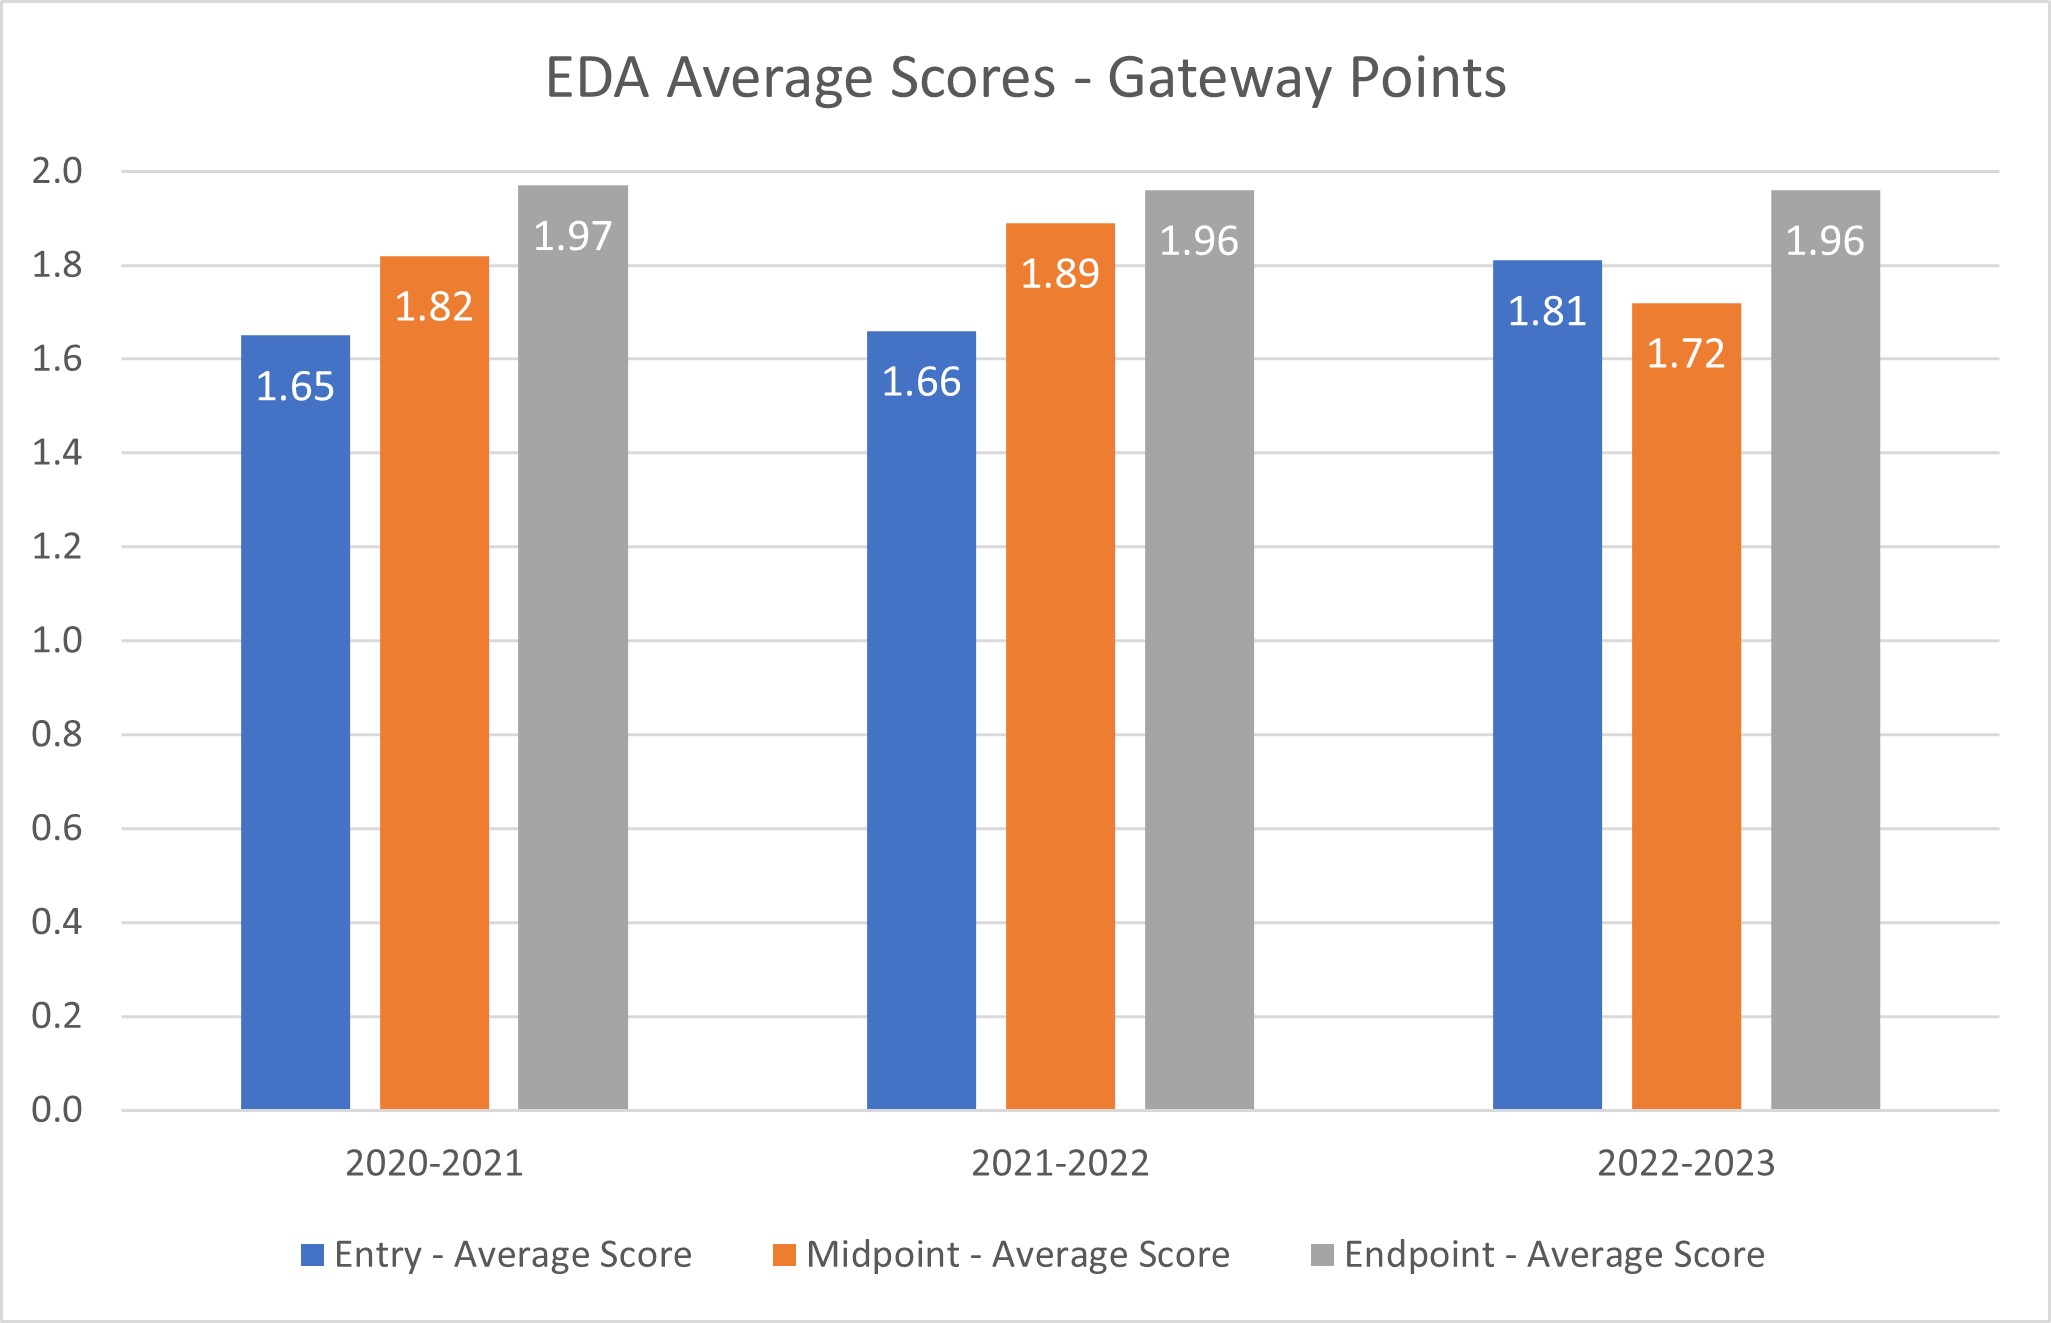 In two prior years, our expectations are confirmed in that we see a stairstep pattern.
However, in 2022-2023, the entry point candidates were rated higher compared to the
other years of data and higher compared to the midpoint data. Midpoint scores in 2022-2023
are also slightly lower than midpoint scores in previous years, but are higher than
entry scores in the previous year. Our initial conclusion is that a group of candidates
joined our program in 2022-2023 who had dispositions that more closely align with
the teaching profession than typical for our cohorts. This result (increased entry
point scores) can be monitored in future years to see if the increase persists for
this cohort and if future incoming cohorts also have higher entry scores.
In two prior years, our expectations are confirmed in that we see a stairstep pattern.
However, in 2022-2023, the entry point candidates were rated higher compared to the
other years of data and higher compared to the midpoint data. Midpoint scores in 2022-2023
are also slightly lower than midpoint scores in previous years, but are higher than
entry scores in the previous year. Our initial conclusion is that a group of candidates
joined our program in 2022-2023 who had dispositions that more closely align with
the teaching profession than typical for our cohorts. This result (increased entry
point scores) can be monitored in future years to see if the increase persists for
this cohort and if future incoming cohorts also have higher entry scores.
Our other expectation, that candidates at the endpoint will be at or close to a 2 (Meets Expectations) rating is borne out in the data over all years. This, plus the general stairstep pattern in the data indicates that our programs move our candidates closer to a pattern of dispositions necessary to be a professional teacher.
As these data are presented by academic year, the data are current as of April, 2024.
This set of assessments aligns to CAEP Annual Report Measure 3: Candidate competency at completion (Component RA3.4)
Our advanced level plans are proceeding with their phase-in plans as presented in our CAEP site visit in fall 2021. Status on these measures is indicated for each program below.
MAED in Comprehensive Education
Rrubrics have been created and validated and preliminary data has been collected.
The assessments include the Methods of Educational Research Rubric and the Specially
Designed Instruction Rubric.
We have investigated reliability for all three rubrics. As of Spring 2024, the Specially
Designed Instruction rubric has been found reliable based on our investigation. We
are presenting data from the most recent academic year since validation of the rubric
in 2021. See the graph below.
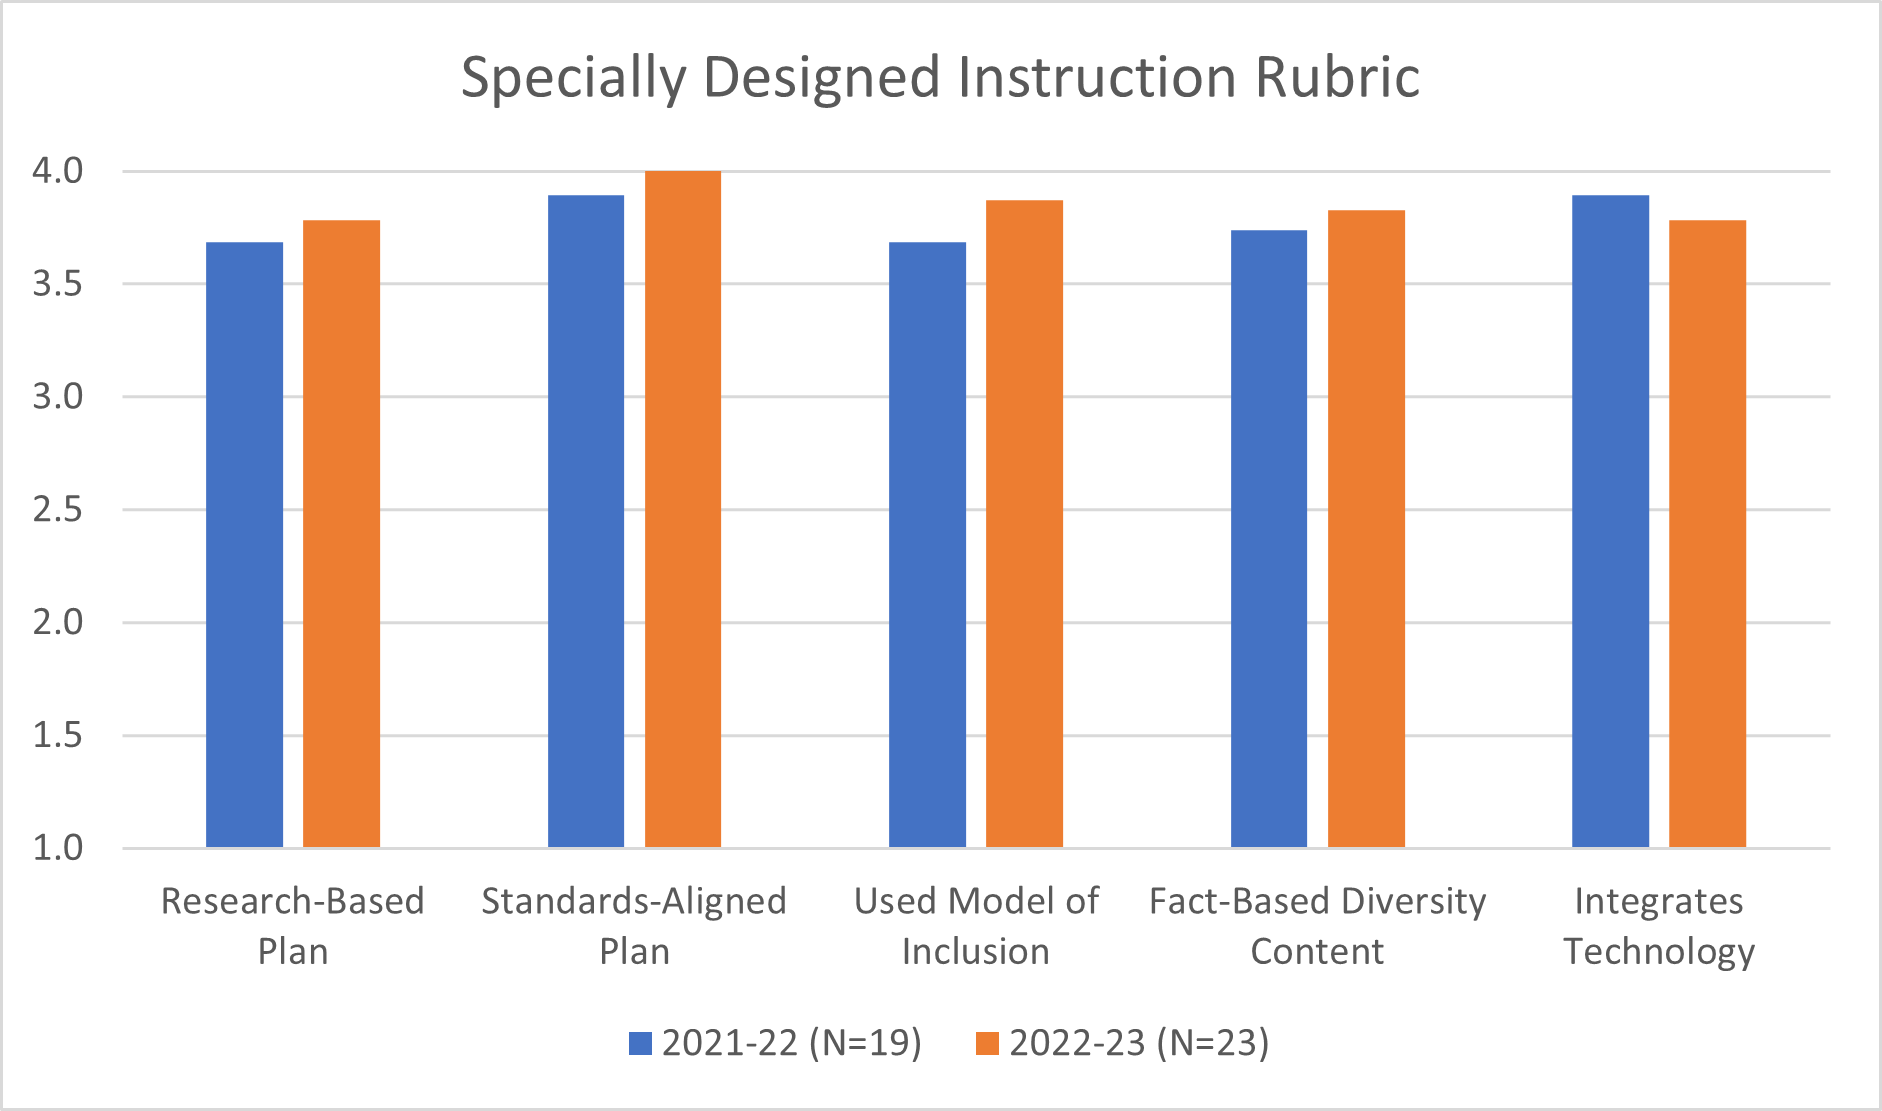
Students are rated on a scale of 1=Unsatisfactory, 2=Developing, 3=Proficient, and
4=Exemplary. As the graph shows, average ratings of students fall between Proficient
and Exemplary. No individual item seems to indicate a significant issue for this construct.
We will continue to collect and monitor this data but no action seems indicated at
this time. This data is the most recent cycle available as of April, 2024.
In spring 2024, we revised our training for the Educational Research rubric to attempt to improve reliability. For this rubric, we established strong internal consistency using student rating data but inter-rater reliability of our faculty after training is not strong. With that caveat, the following graph is our data from academic years since the validity of the rubric was established.
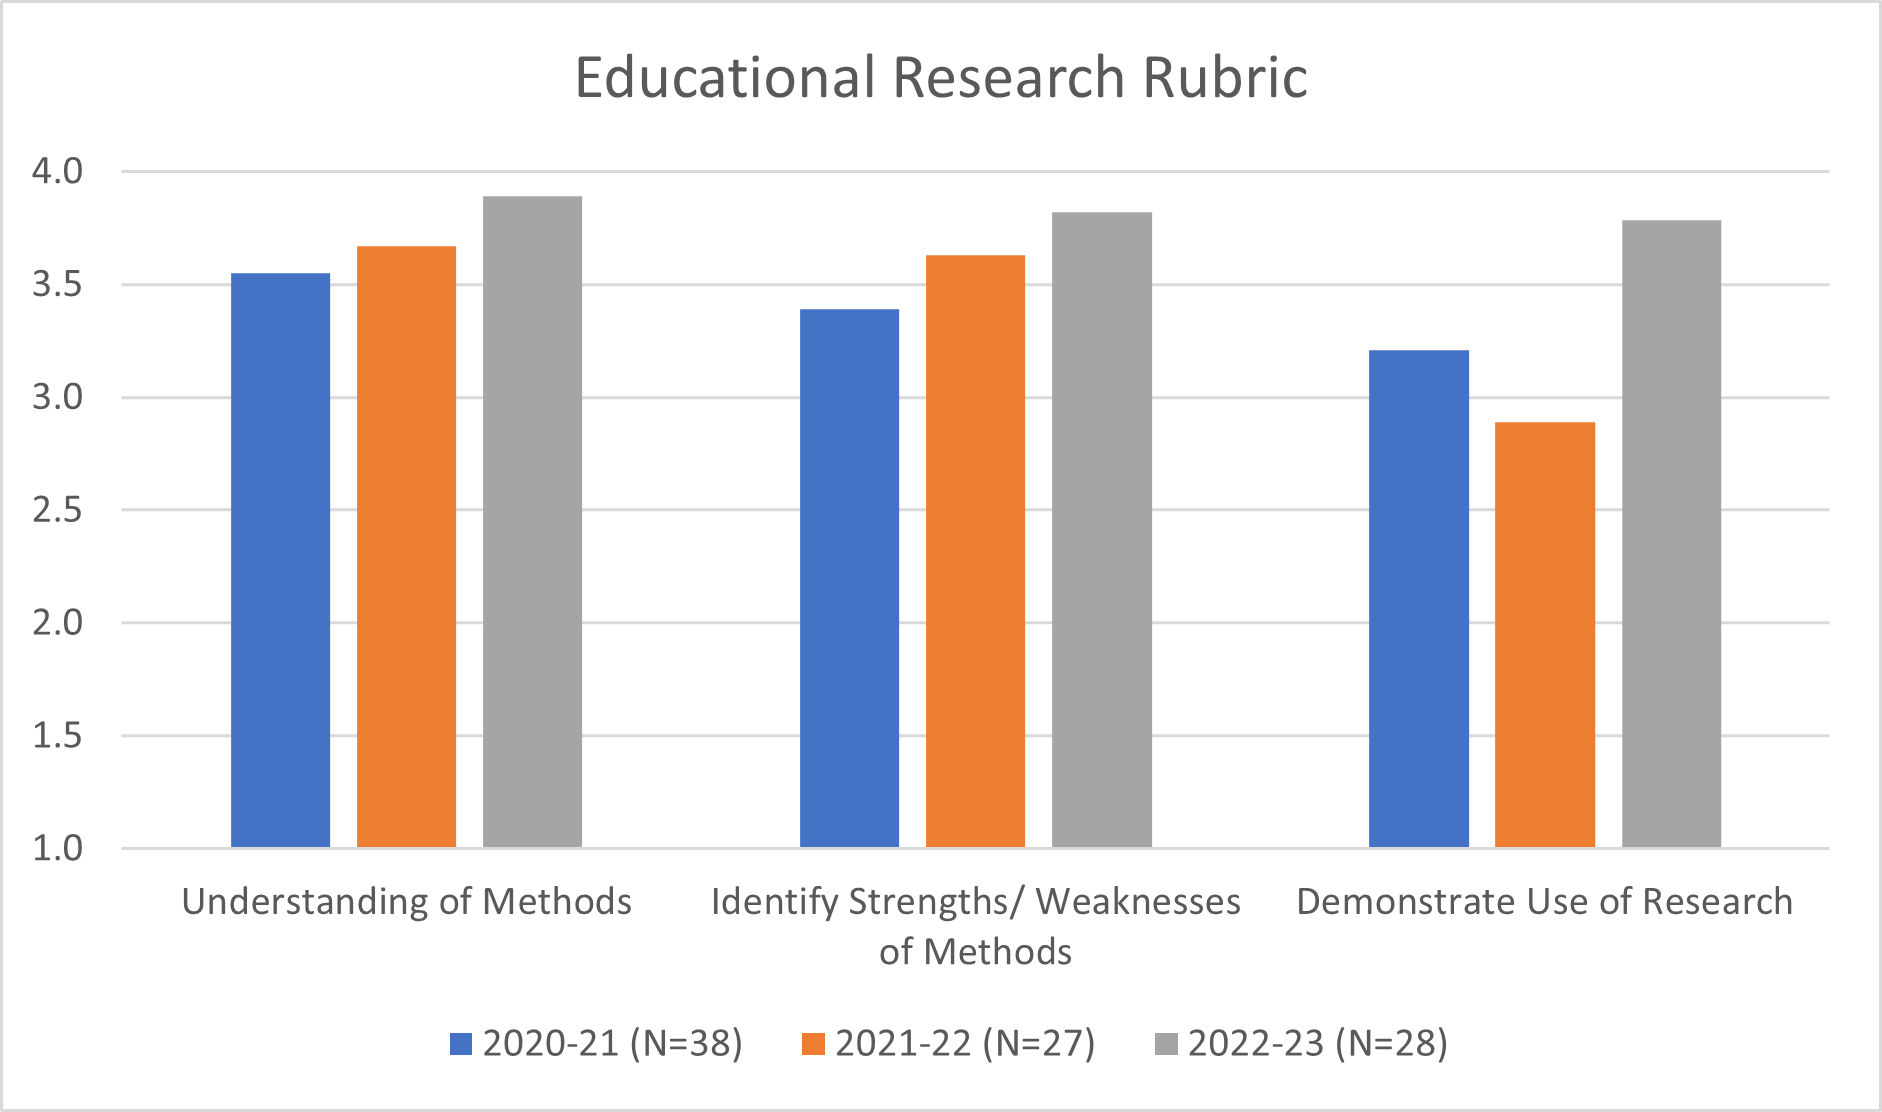 Students are rated on a scale of 1=Unsatisfactory, 2=Developing, 3=Proficient, and
4=Exemplary. As the graph shows, most average item scores are in the proficient to
exemplary range. One item, Demonstrate Use of Research fell below the Proficient level
in 2021-22, but in 2022-23 increased again to be comparable to the increases of the
other rubric items in the same year. The program is reviewing this result but for
now considers this an issue for that individual cohort and not a pattern we must act
on. This is the most recent data available as of March 2024.
Students are rated on a scale of 1=Unsatisfactory, 2=Developing, 3=Proficient, and
4=Exemplary. As the graph shows, most average item scores are in the proficient to
exemplary range. One item, Demonstrate Use of Research fell below the Proficient level
in 2021-22, but in 2022-23 increased again to be comparable to the increases of the
other rubric items in the same year. The program is reviewing this result but for
now considers this an issue for that individual cohort and not a pattern we must act
on. This is the most recent data available as of March 2024.
SSP in School Psychology
The program has created evaluations for graduate student (candidate) work involving psychological assessments and consultation intervention case studies completed during their field-based and clinic-based practicum and internship experiences. Validity has been established for these measures as of Summer 2020. Cohorts in the program are small and therefore, aggregated data is collected and reported every year.
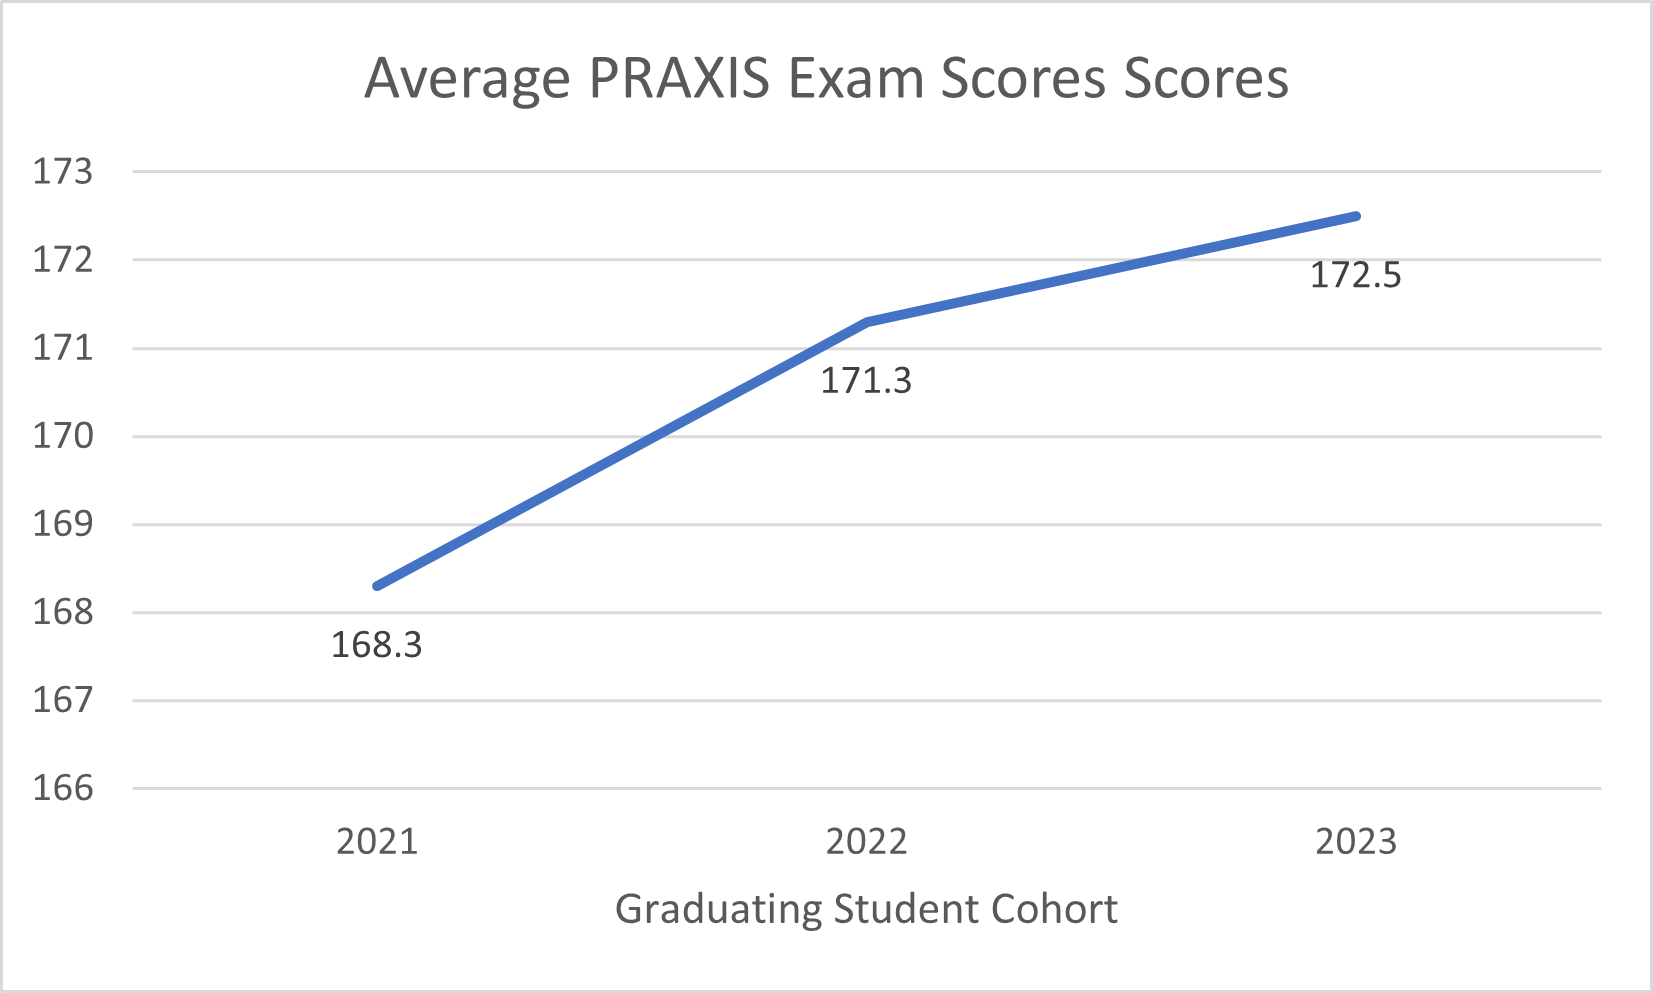
The PRAXIS exam for School Psychology is required to be licensed in North Carolina and for graduation from this program. Candidates are required to achieve a passing score of 147. Every year, 100% of WCU students have passed the Praxis exam, as have 100% of all in North Carolina. The Average passing score for the WCU school psychology graduate students is provided in the chart below. There has been a slight improvement in scores over the past 3 years.
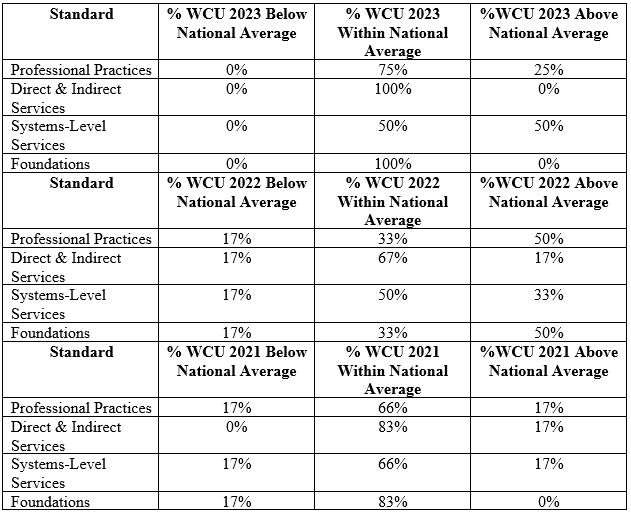
When compared to the national average for each standard measured on the Praxis exam, the WCU candidates have always done well as illustrated in the chart below. No patterns have been identified indicating specific areas for the program to work on for improvements although Systems Level Services have been areas of greater strength the past couple of years which reflects some of the additional emphasis placed on this within the program.
 Though the WCU mean score is slightly lower than the state’s overall, it remains substantially
higher than the required passing score of 147. This, along with our 100% pass rate
for these years, indicate the strength of our program in preparing candidates. This
is the most recent data available as of March, 2024.
Though the WCU mean score is slightly lower than the state’s overall, it remains substantially
higher than the required passing score of 147. This, along with our 100% pass rate
for these years, indicate the strength of our program in preparing candidates. This
is the most recent data available as of March, 2024.
All candidates must complete a field-based practicum and a clinic-based practicum and be evaluated at a proficient level to be ready to enter internship. Data from supervisor evaluations of these experiences is presented in the tables below. This data indicates a drop in Average performance for the 2022-2023 year due to one student in particular who struggled, which led to the creation of an action plan, and additional practicum requirements prior to being allowed to enter internship.
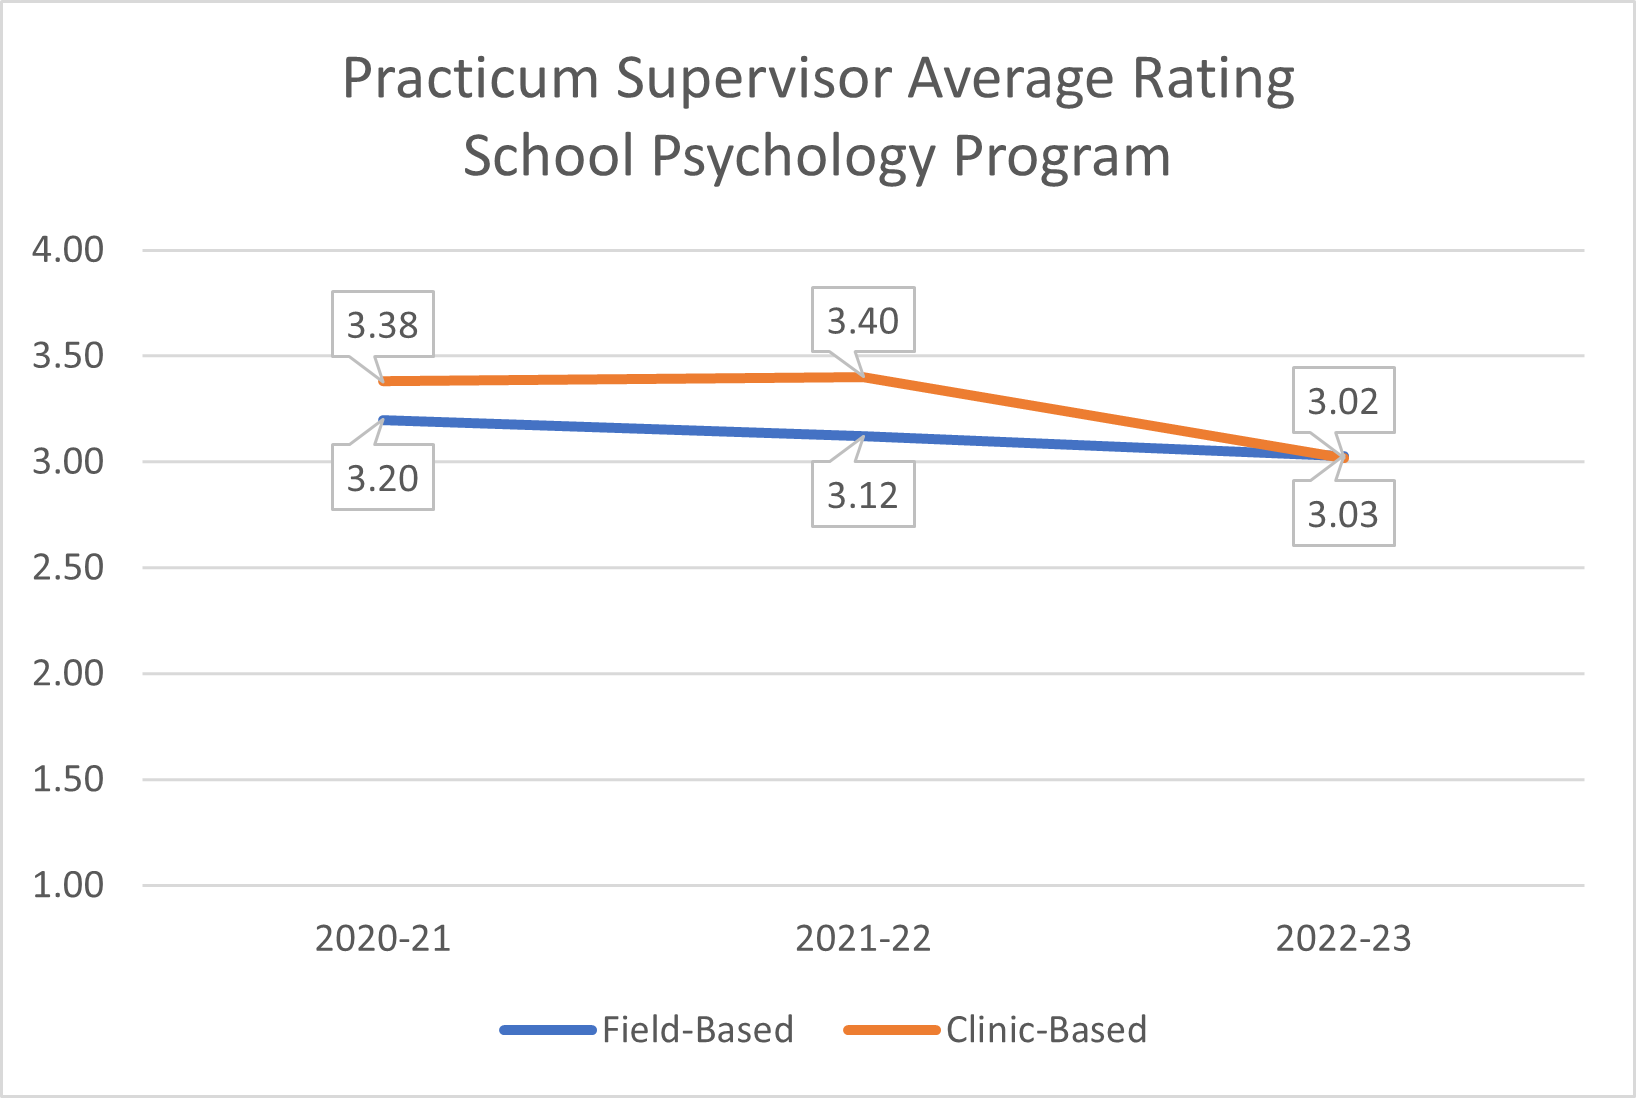
For both rubrics, candidates are rated on a four-point scale on multiple items relevant to the respective experience. The scale is: 1=Unsatisfactory, 2=Developing, 3=Proficient, and 4=Exemplary. We will continue to monitor this data. This is the most recent data available as of April, 2024.
MSA in School Administration
The MSA Program evaluates candidates on criteria related to Strategic Leadership and Leadership for Social Justice. The program has established reliability and validity for these assessments. Students are evaluated during the second year in the program at the end of the Fall Semester during Internship I and then again at the end of the Spring Semester during Internship II. There were 19 students In the 2022-2023 Cohort; all 19 were evaluated during Internship I and 18 were evaluated during Internship II.
Both rubrics use a 4-point scale and include a description of the criteria for each score. The Strategic Leadership Scale verbal qualifiers are Emerging, Developing, Proficient and Exemplary and students are evaluated on the quality, breadth and depth of the leadership skill measured. The Social Justice Scale qualifiers are None, Minimal, Moderate, and Strong, and students are evaluated based on the quality, and depth of students’ demonstration of elements of social justice issues.
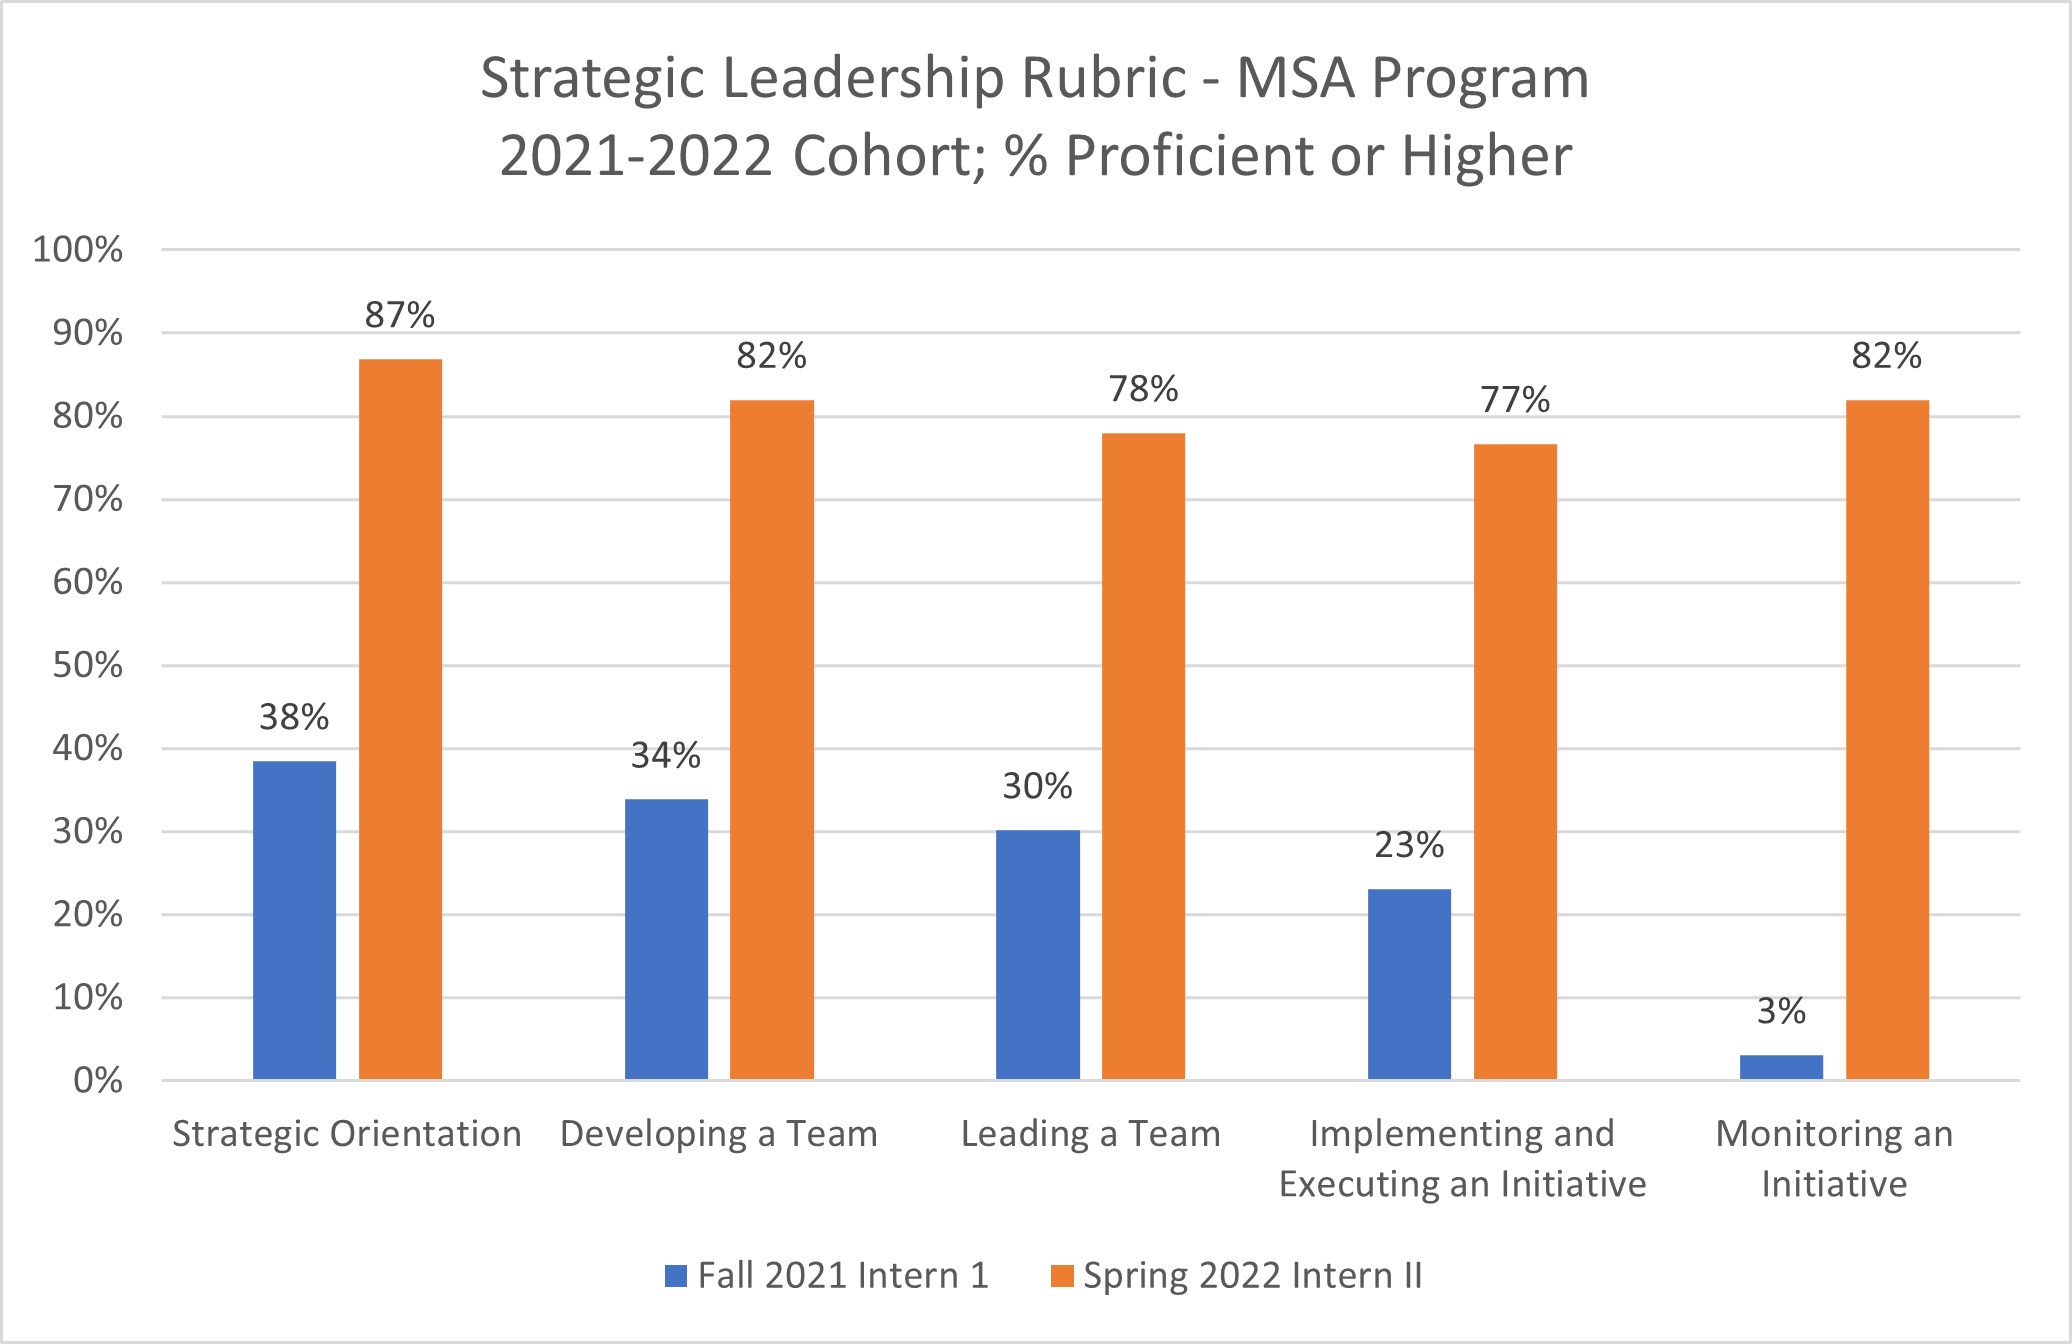
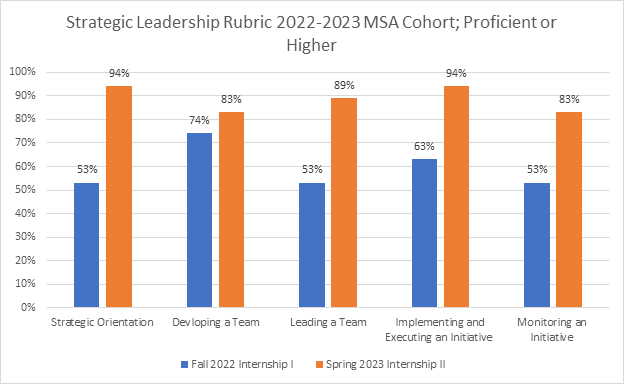
In 2022-23, there was substantial growth from the Fall to the Spring across all categories of Strategic Leadership, with no less than 80% of the cohort earning proficient or exemplary by the end of the program. In two categories: Strategic Orientation and Implementing and Executing an Initiative 94% of the cohort was proficient or higher.
With respect to Leadership for Social Justice the growth between Internship I and II was palpable. The entire cohort demonstrated moderate or strong evidence in recognizing systemic roots of problems of practice in their local contexts. Additionally, all students demonstrated moderate or strong evidence in identifying and utilizing an initiative aimed at dismantling some form of inequity in their school. Almost 80% of the students were able to demonstrate at least moderate evidence of being able to capitalize on assets. We note that results for both Intern I and II in 2022-23 are higher than 2021-22.
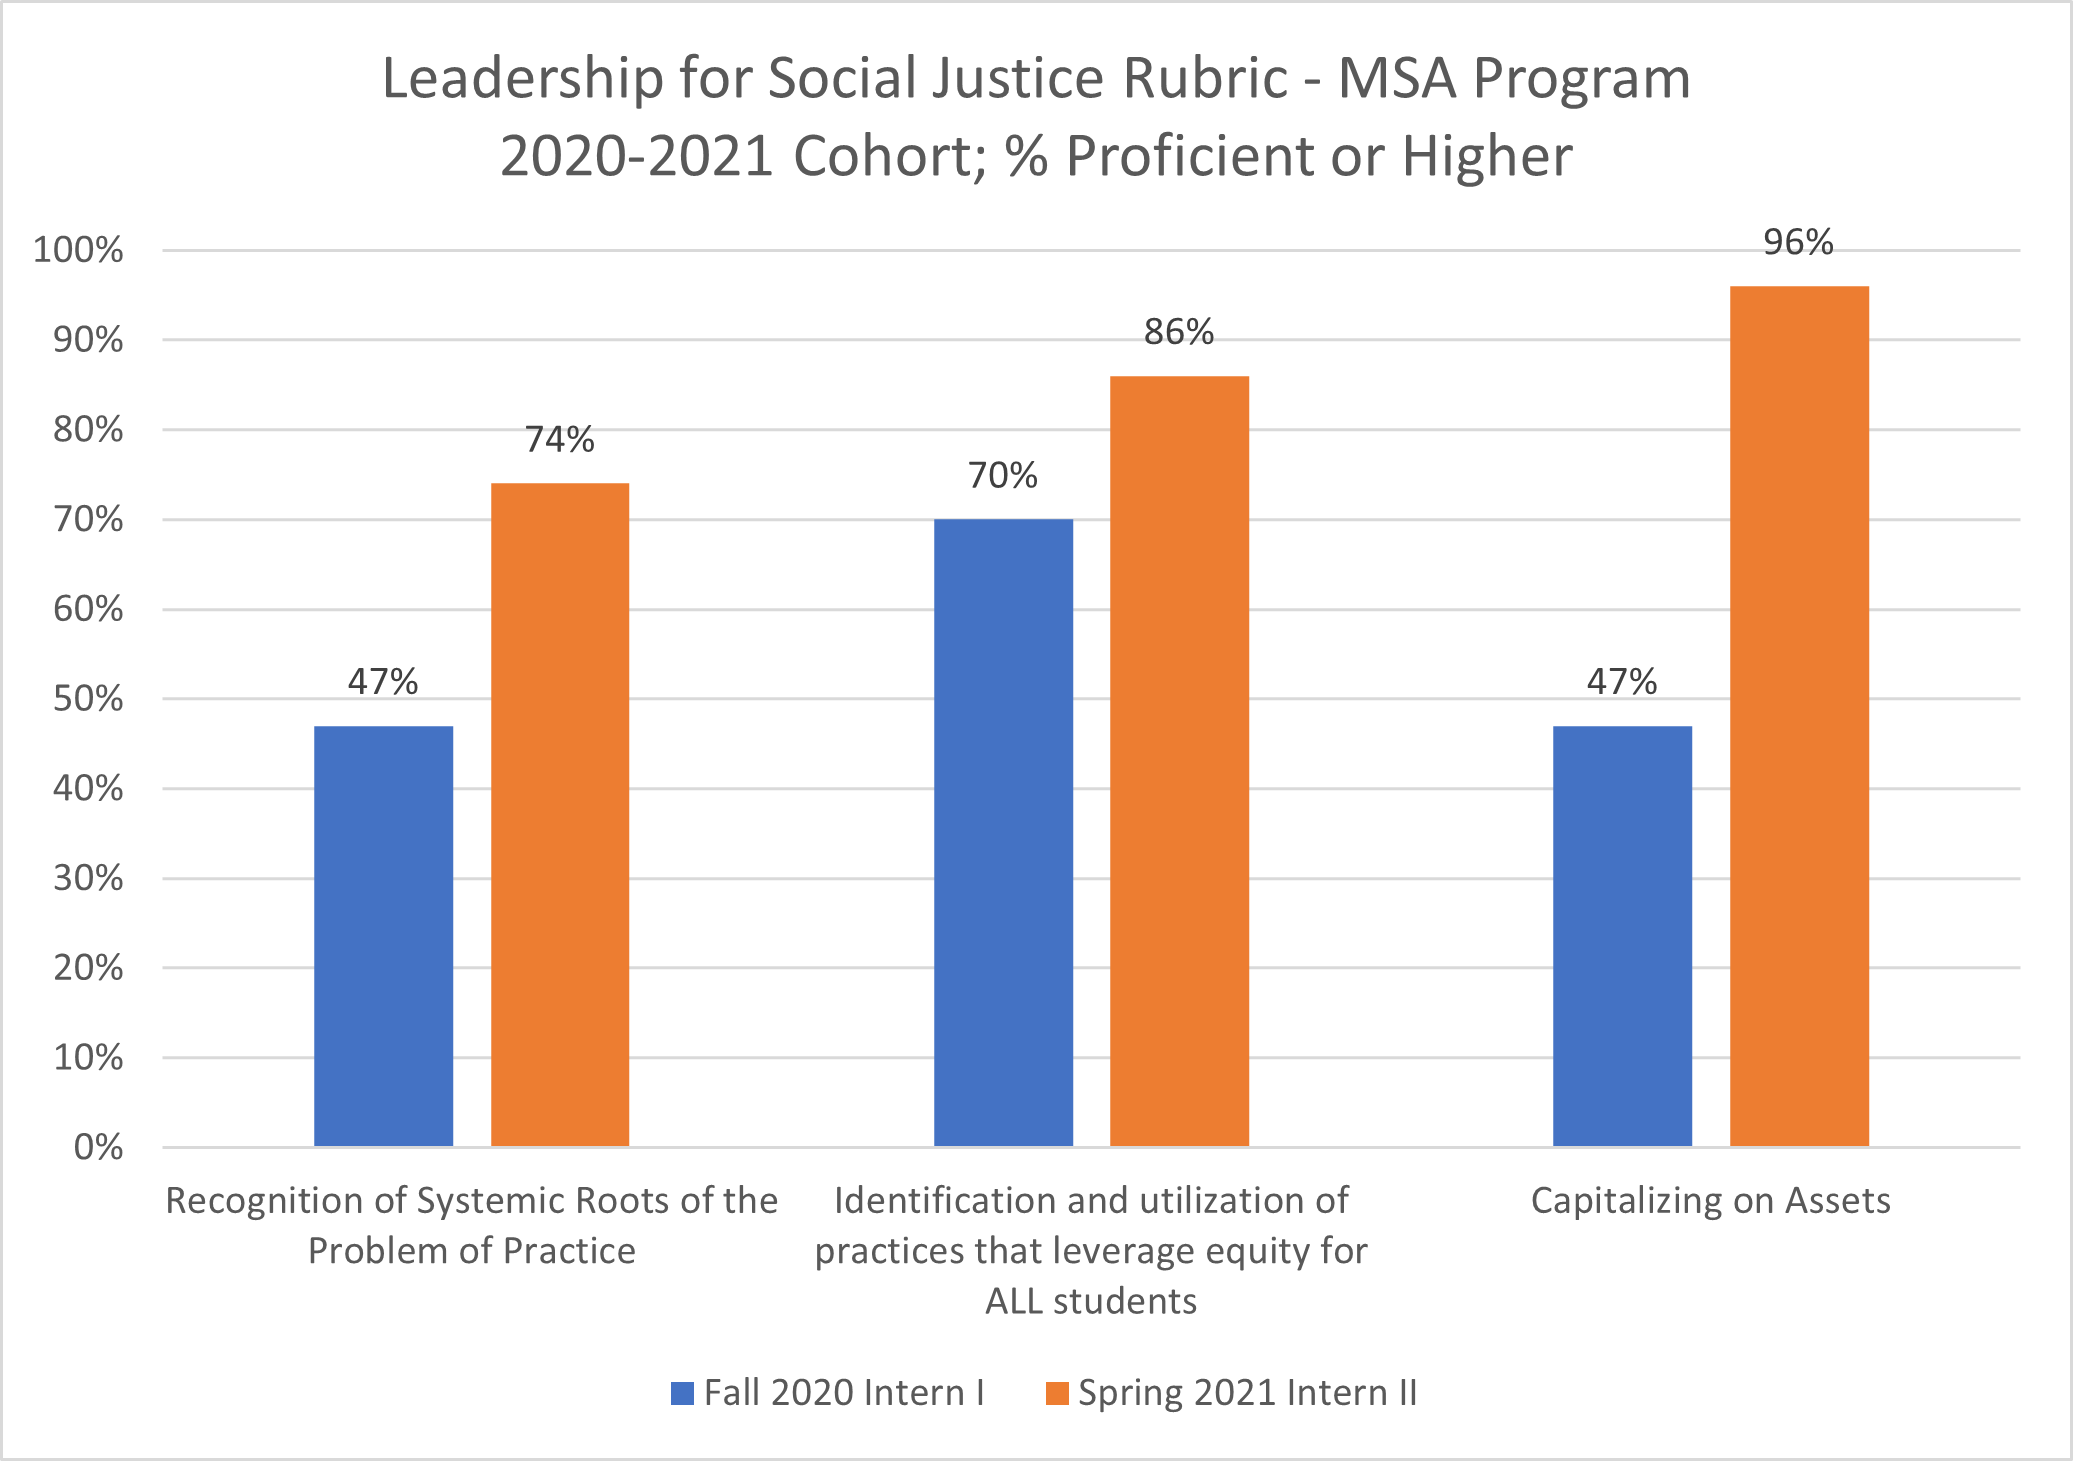
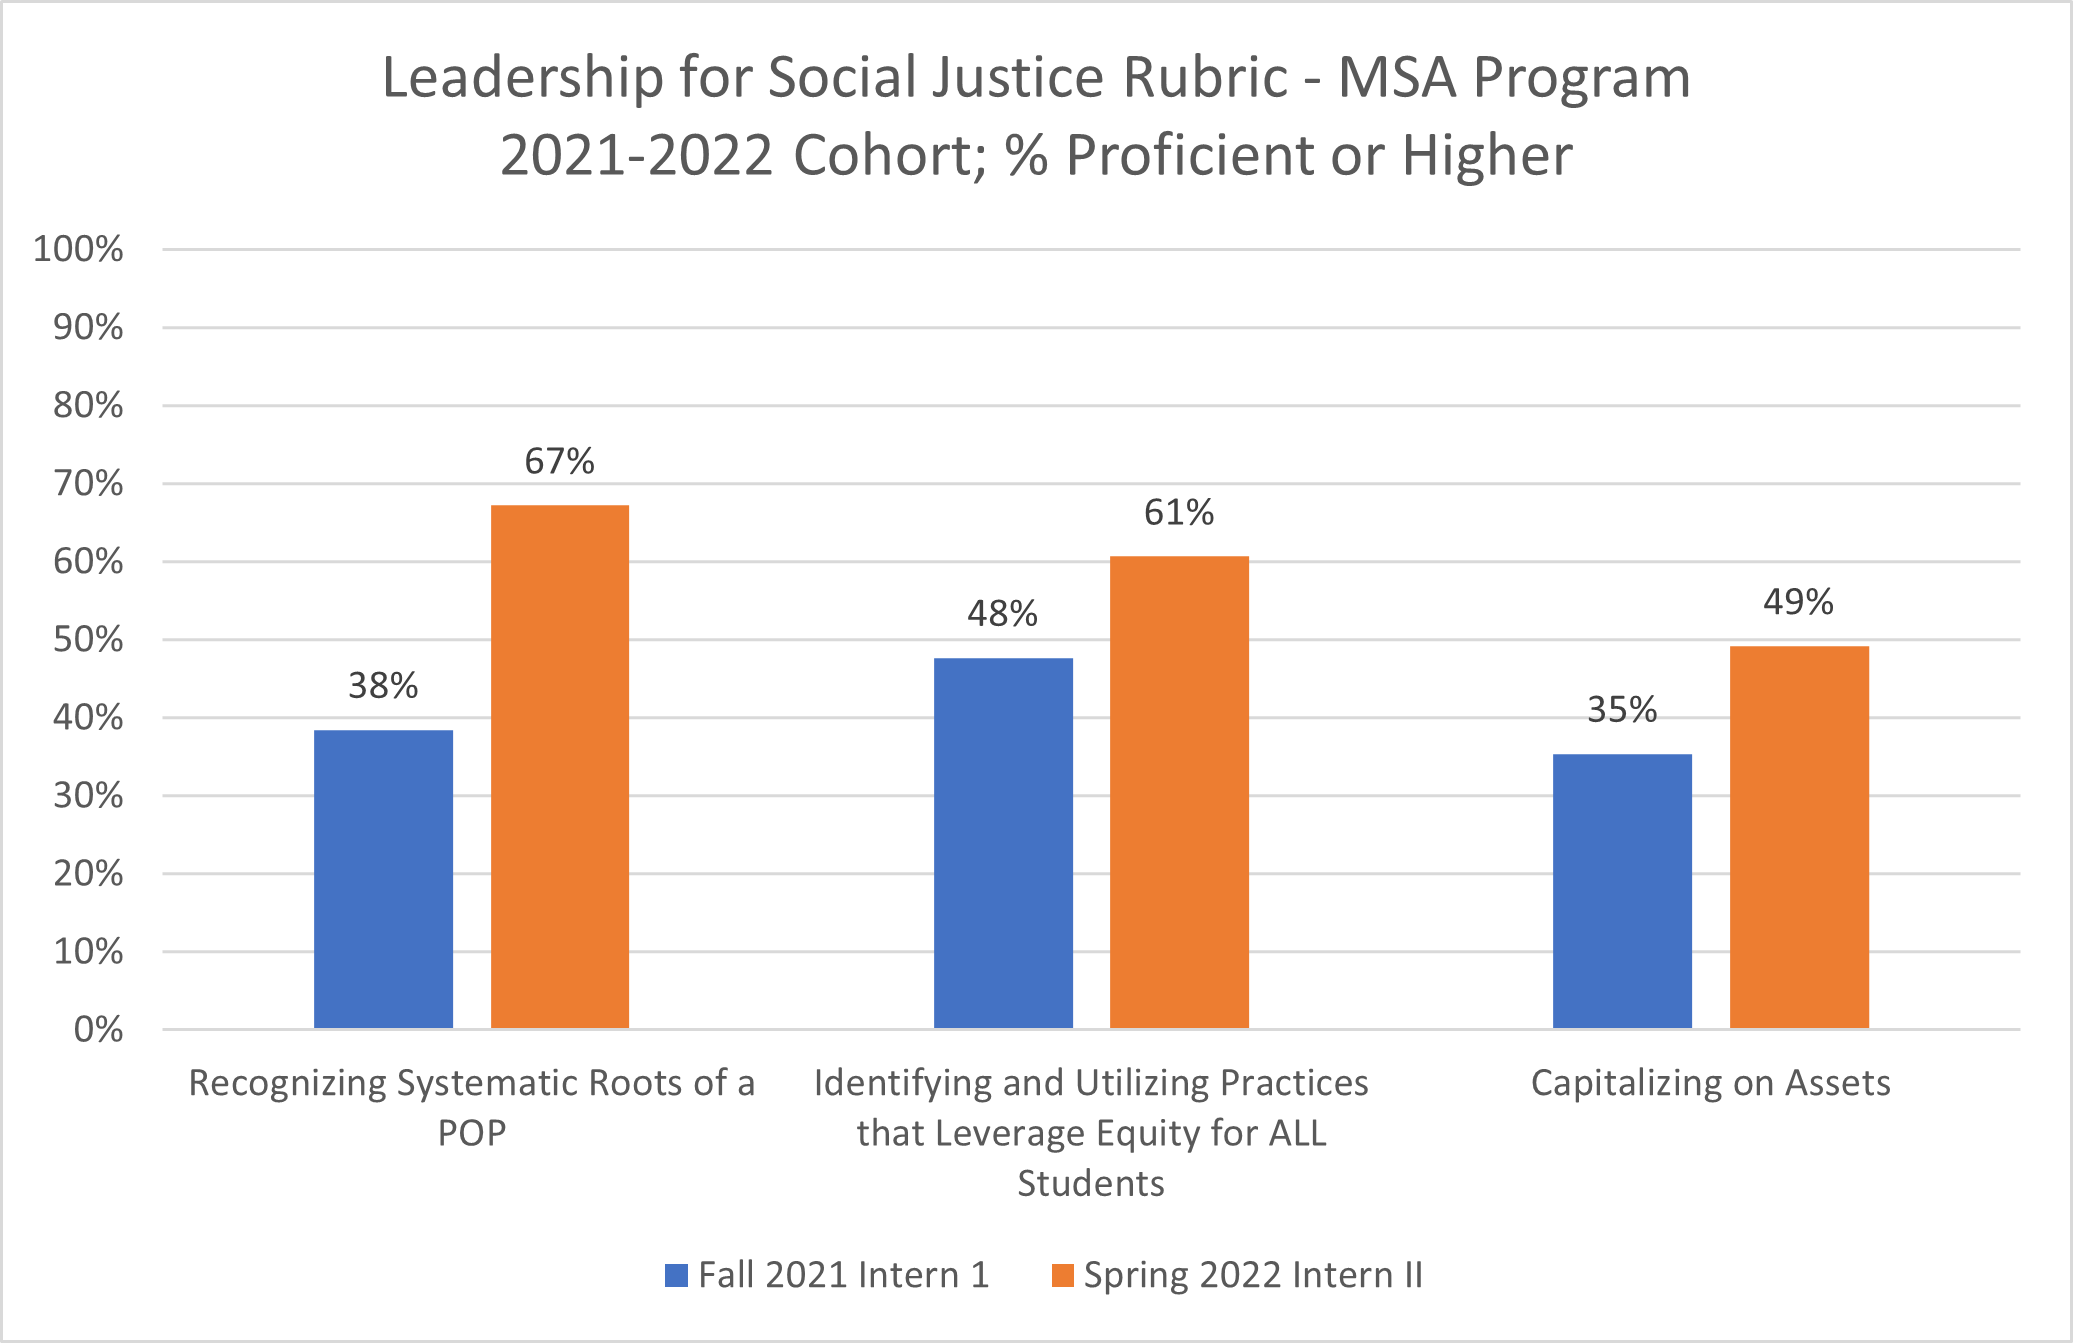
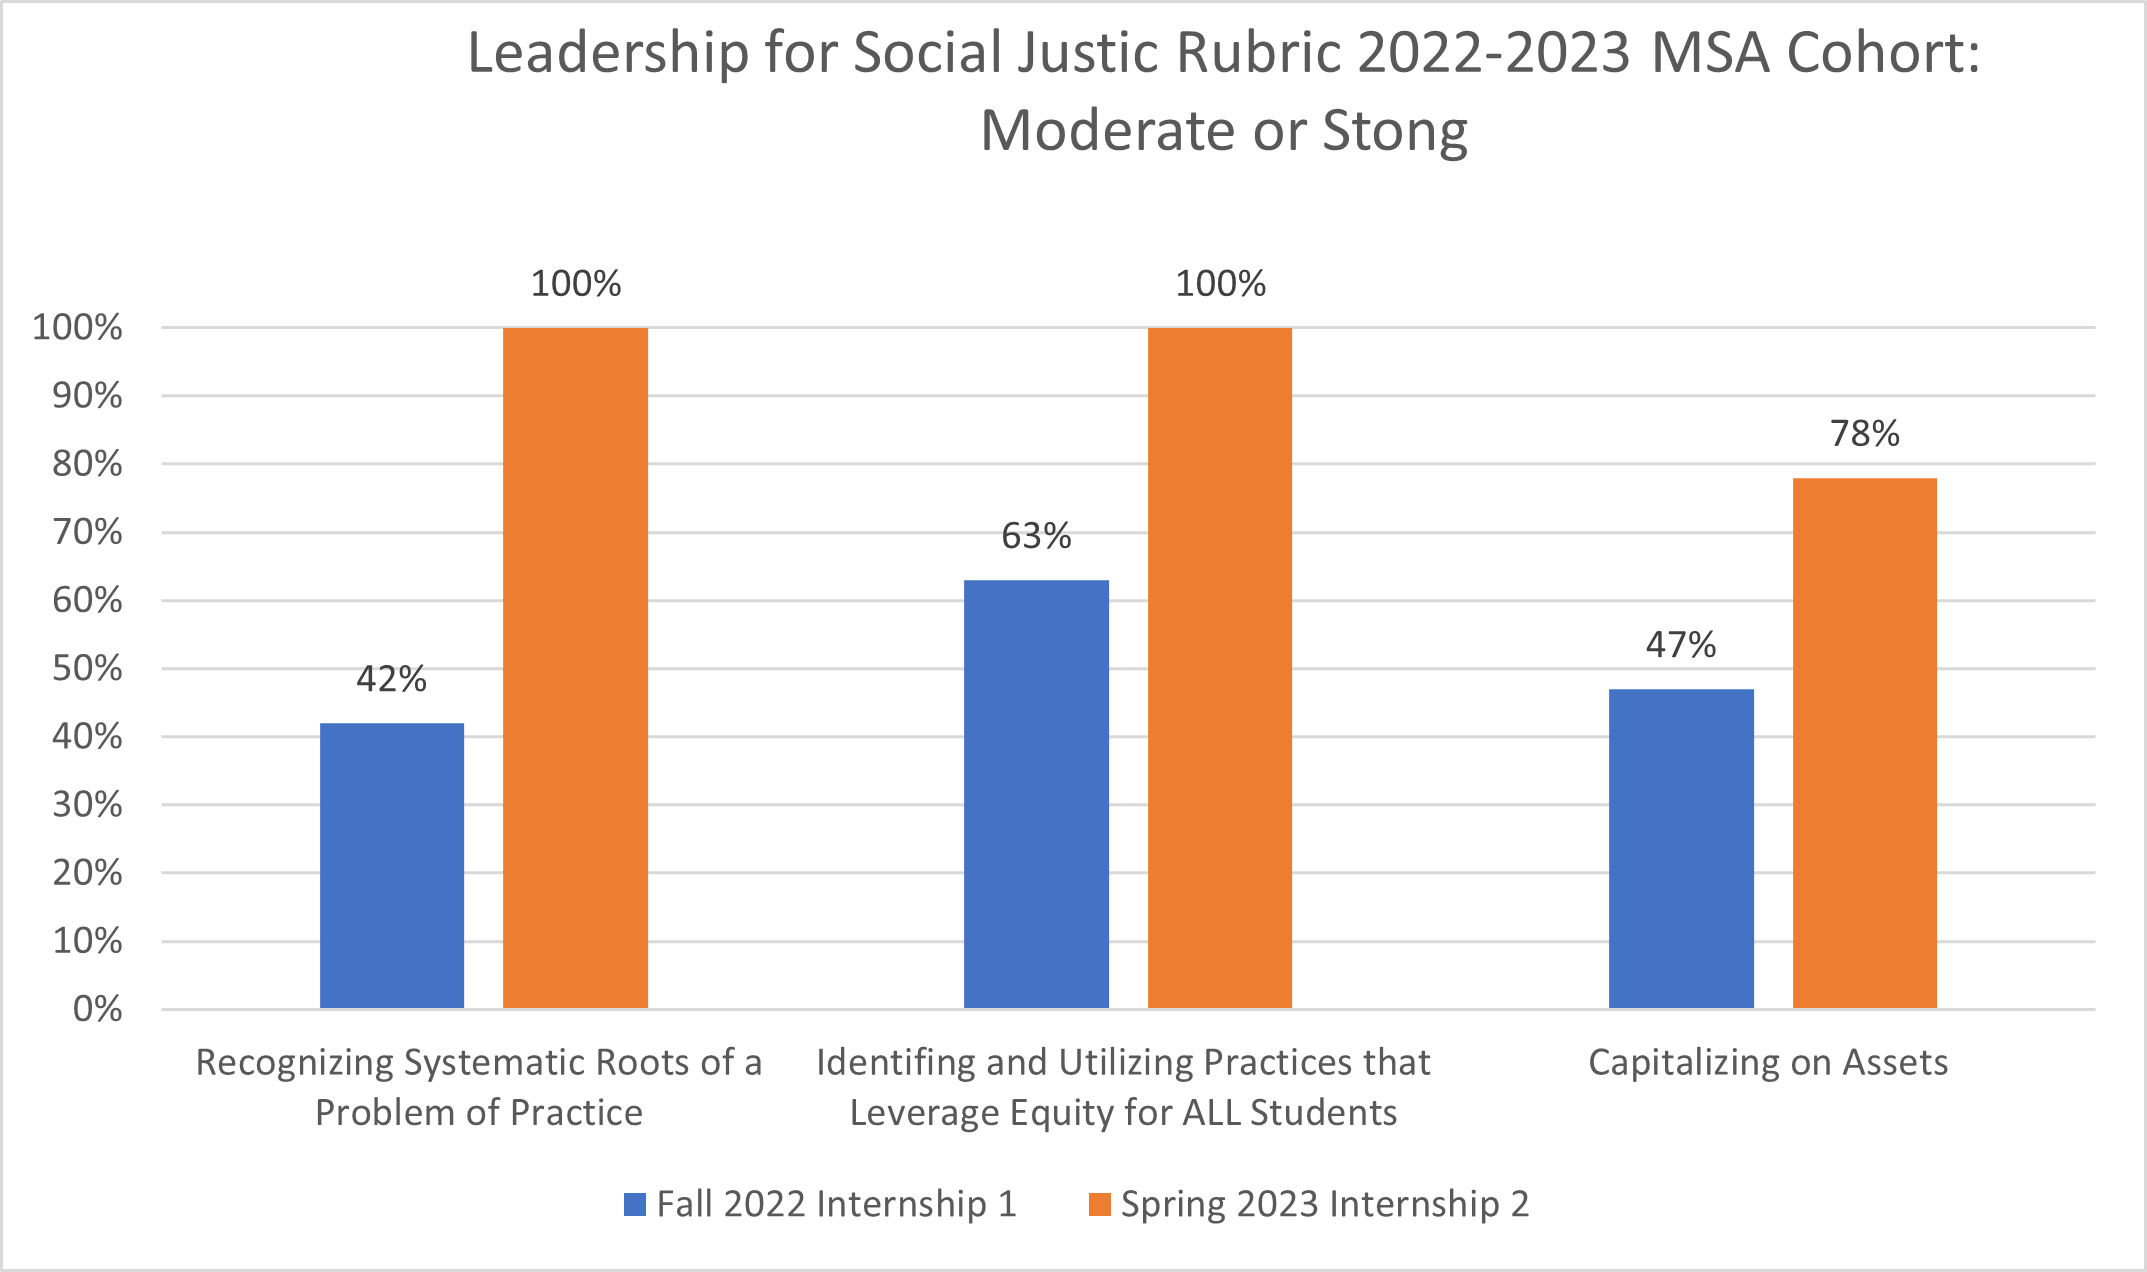 Given these results, no immediate action seems warranted. We will continue to monitor
this data for future cohorts. This is the most recent data as of April 2024.
Given these results, no immediate action seems warranted. We will continue to monitor
this data for future cohorts. This is the most recent data as of April 2024.
EdD in Educational Leadership
In the EdD in Educational Leadership program, candidates are evaluated on their Disquisition, which is their final product in the program. We present here the average ratings of the most recent three cohorts in the EdD program. All items are rated on a four point scale.
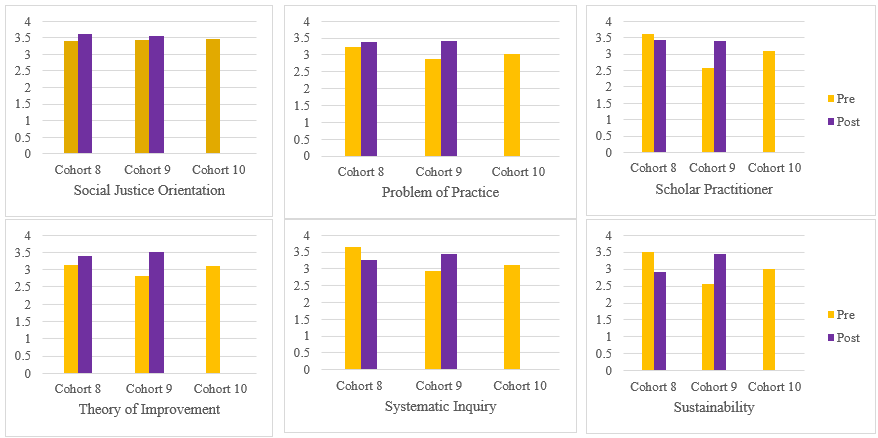 As can be seen in the graph, candidates’ evaluations, particularly growth, are overall
positive. In the Fall of 2022, the program faculty decided to have all committee members
evaluate students (previously only committee members who are faculty in the program
evaluated students on this rubric). Thus, the number of evaluations for cohort 8 pre
was 16 versus 34 for the post, more than double for the post assessment. The increase
in sample size and the lack of training for committee faculty external to the program
may contribute to some of the post scores lower than the pre scores. This issue self-corrected
for Cohort 9 when all committee members evaluated students during the proposal and
after the final defense. We do not see a pattern in the data that indicates an issue
we need to address but will continue to monitor. As of April 2024, this is the most
recent data available.
As can be seen in the graph, candidates’ evaluations, particularly growth, are overall
positive. In the Fall of 2022, the program faculty decided to have all committee members
evaluate students (previously only committee members who are faculty in the program
evaluated students on this rubric). Thus, the number of evaluations for cohort 8 pre
was 16 versus 34 for the post, more than double for the post assessment. The increase
in sample size and the lack of training for committee faculty external to the program
may contribute to some of the post scores lower than the pre scores. This issue self-corrected
for Cohort 9 when all committee members evaluated students during the proposal and
after the final defense. We do not see a pattern in the data that indicates an issue
we need to address but will continue to monitor. As of April 2024, this is the most
recent data available.
The NC Department of Public Instruction maintains a data dashboard that allows you to examine the percentage of our graduates who are employed in North Carolina public schools within three years of completion of their program. In the filters at the top, you can select different graduating cohorts by calendar year. In the list of all EPPs in the center of the page, click to highlight "WCU" in the list. This will filter all other data to display from WCU. For comparison, click on the highlighted WCU in the center graph to unselect it; this removes the filter and allows you to see the ratings for all beginning teachers in the state. The left graph indicates the percentage of graduates in each year that obtained employment in a North Carolina public school within 3 years of completing the program. Comparing WCU graduates to the whole state, our completers are employed at somewhat lower rates than for the state with pronounced dips in 2020 and 2022. Anecdotally, we are aware many of our students pursue employment in bordering states. Given our geographic proximity to several other states with higher initial teacher pay, this may partly explain this trend. We will monitor this data to determine if the lower trends continue, though we do see an increase with our 2023 cohort retention. One confounding factor is we do not have employement data for our graduates outside of North Carolina public schools.
We last examined this data in April 2024; at that time the dashboard had data through calendar year 2023.
CEAP Assessment Process
Fall Strategic Planning Day - September 13, 2024
CIRs due to college - September 20, 2024
Spring Strategic Planning Day - January 31, 2025
University Faculty Resources
CEAP College Assessment Site and Resources (requires WCU login)
Advanced Licensure Portfolio Documentation
WCU Assessment and Strategic Program Review
The following are links to campus, state and national resources regarding assessment preparation, the latest news and legislation on education-related issues, plus tools and information for ongoing learning.
AACTE - American Association of Colleges for Teacher Education
NC DPI - North Carolina Department of Public Instruction
CAEP - Council for the Accreditation of Educator Preparation
SACSCOC - Southern Association of Colleges and Schools Commission on Colleges
NCTEAN - North Carolina Teacher Education Assessment Network
Mission
The Assessment Office supports the mission of the college by generating data to ensure program quality and institutional effectiveness. The office supports the assessment system, coordinates college-wide assessment activities, and provides data for internal and external reporting agencies including national CAEP accreditation, Title II reporting, and the North Carolina Department of Public Instruction.
Our teacher and professional education programs are accredited by the Council for the Accreditation of Educator Preparation (CAEP).
Assessment Consultation
Request assistance with data, reporting, assessments, etc.
Contact Us
Dr. Lee Nickles
Associate Dean for Academic Affairs
College of Education and Allied Professions
201L Killian
Western Carolina University
Cullowhee, NC 28723
Phone: 828.227.3299
Email: lnickles@wcu.edu