- Community & Alumni Engagement
- Community and Economic Engagement
- Public Policy Institute
- Regional Outlook Report
- Chapter 2: A Snapshot of Public Opinion in Western North Carolina
Chapter 2: A Snapshot of Public Opinion in Western North Carolina
INTRODUCTION AND DESCRIPTION OF THE SAMPLE
To learn more about the attitudes and opinions of residents of Western North Carolina, we contracted with a third-party vendor [ 2] to conduct a scientific telephone survey of Western North Carolina residents during summer of 2013. The survey, designed by Drs. Brennan and Cooper, asked a variety of questions about the economic, social, and political opinions of WNC residents.
Given that more than a third of the U.S. population has a cell phone, but not a land-line, and considering that “cell-phone only” households are demographically distinct from those with land-lines [ 3] , both wireless and landline numbers were called. The wireless sample included only households that did not have a land-line (so we would not include the sample household twice). All households selected for the survey were dialed up to five times to attempt to reach a respondent. Every attempt was made to randomize respondents within a household.
Once the data were collected, we weighted the sample by age, sex, and race (using data from the 2011 American Community Surveys from the U.S. Census Bureau) to improve our survey estimates. After weighting and all sampling considerations, we are 95% confident that our results accurately represent the population of WNC within approximately +/-3.5 percent. This is comparable to other major population surveys in the field.
After weighting, the sample characteristics appear close to observable characteristics
of the population in WNC. For example, the average respondent in our sample is 45
years old, 94 percent [ 4] of our respondents are year-round residents, and the average respondent has lived
in WNC 69 percent of his/her life. Tables 2-1 through 2-5 review the demographic characteristics
of the sample by county, race and ethnicity, educational attainment, marital status,
and income.
|
Table 2-1. Counties Represented in the Sample |
|
|
County |
Weighted Percent of Sample |
|
Alleghany |
1% |
|
Ashe |
2% |
|
Avery |
2% |
|
Buncombe |
24% |
|
Burke |
8% |
|
Caldwell |
6% |
|
Cherokee |
3% |
|
Clay |
1% |
|
Graham |
0% |
|
Haywood |
5% |
|
Henderson |
12% |
|
Jackson |
4% |
|
McDowell |
4% |
|
Macon |
4% |
|
Madison |
2% |
|
Mitchell |
1% |
|
Polk |
3% |
|
Rutherford |
5% |
|
Swain |
1% |
|
Transylvania |
3% |
|
Watauga |
3% |
|
Wilkes |
6% |
|
Yancey |
2% |
|
Sample |
894 |
|
Table 2-2. Race and Ethnicity of the Sample |
|
|
Race/Ethnicity |
Weighted Percent |
|
African-American/Black |
4% |
|
Anglo-American/White/Caucasian |
88% |
|
Asian or Asian-American |
1% |
|
Chicana/Chicano or Mexican American |
3% |
|
Native-American or Indian |
1% |
|
Other |
2% |
|
Multiple Races |
1% |
|
Table 2-3. Educational Attainment of the Sample |
|
|
Educational Attainment |
Weighted Percent |
|
8 th Grade or less |
1 |
|
Some high school |
6 |
|
High School graduate or GED |
20 |
|
Trade School/Community College |
13 |
|
Some College |
25 |
|
College Graduate |
21 |
|
Graduate Degree |
14 |
|
Table 2-4. Marital Status of the Sample |
|
|
Marital status |
Weighted Percent |
|
Married |
49 |
|
Living in a marriage type relationship |
6 |
|
Widowed |
10 |
|
Divorced |
10 |
|
Separated |
2 |
|
Never Married |
23 |
|
Table 2-5. Income of the Sample |
|
|
Income |
Weighted Percent |
|
Under $20,000 |
20 |
|
$20,000-$39,999 |
25 |
|
$40,000-$59,999 |
19 |
|
$60,000-$79,999 |
17 |
|
$80,000-$99,999 |
9 |
|
$100,000 or more |
11 |
ISSUE AREAS
We began the survey with a series of questions about various policy issues in the
region. To determine relative issue importance, we asked respondents to rate on a
scale of 1-100 how important the following issues are to WNC: the economy, employment
and industry, the environment, land-use planning, education, and health care. Higher
ratings on these questions indicate the respondent believes the issue is more important.
As demonstrated in Figure 2-1, our respondents do not differentiate between these
issues with one notable exception—land-use planning, which falls considerably below
the other issue areas in importance. Education is considered the most important issue,
but we caution the reader not to infer too much from the ordering of these issue areas
as most lie closely together and are within the margin of error.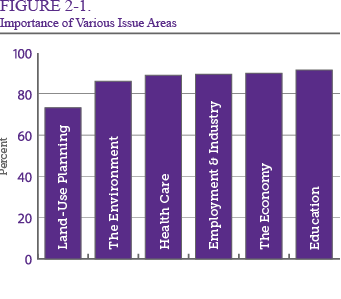
Next, we asked our respondents more about specific issues related to growth and land management to learn more about the valence of their opinions. The first question in this series asked respondents to indicate whether they believe growth in the western region of the state is mostly negative, mostly positive, or equally negative and positive. Equal percentages (26 percent) of respondents believe growth to be “mostly positive” and “mostly negative” with the plurality of respondents placing their attitudes in the middle. In the previous version of our survey, slightly more respondents fell on the positive side of the scale (32 percent), while the numbers who fell in the middle were virtually identical. Residents of Buncombe County, people who have lived in WNC a smaller proportion of their lives, and people with more income generally see growth in more positive terms.
Next, we asked respondents to rate their agreement with three specific land-use policies
using a five-point scale ranging from strongly favor to strongly oppose: land-use
planning, restricting steep-slope development, and restricting ridge-top development.
As Figure 2-2 indicates, respondents feel most positively toward land-use planning
followed by restricting steep-slope development and restricting ridge-top development,
respectively. The land-use planning results are almost identical to the 2008 survey,
while the other questions were asked in a slightly different fashion in 2008 and cannot
be compared. 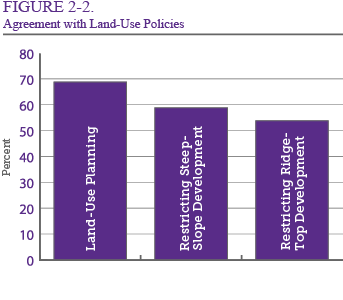
When we examine which types of people tend to fall on each end of the land-use planning opinion scale, we find that people with more education, Democrats, and people who have lived in WNC a smaller proportion of their lives are more supportive of restricting land-use planning. The patterns for opinions of ridge-top development differ slightly such that residents of Buncombe County, younger people, and ideological liberals are more supportive of restrictions. Finally, older people and people of higher incomes are more likely to support restricting steep-slope development.
Respondents were then asked to assess air and water quality in WNC (see Figure 2-3).
Overall, the responses indicate that residents of WNC assess the environmental conditions
in the region quite positively. For air quality, approximately 20 percent of respondents
answered excellent, 54 percent good, 21 percent fair, and 5 percent poor. For water
quality, the results were almost identical (21, 52, 20 and 7 percent, respectively).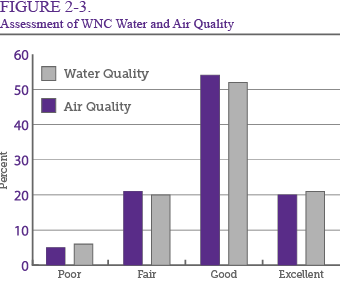
Despite these similarities, the types of people who positively assess each of these areas do vary. For example, while Republicans are more likely than Democrats or Independents to perceive air quality in the region as positive, they are less likely to perceive water quality in the region as positive. The percentage of a person’s life they have lived in WNC also affects their view of air quality; the larger a proportion of a person’s life they have lived in WNC, the lower they perceive the air quality to be in the region. These findings demonstrate that, despite similar overall sample assessments of air and water quality in WNC, different types of people view these areas differently.
THE PERSONAL AND PUBLIC ECONOMY
We asked respondents a series of questions about their personal economic situation and their opinions of the economy in the region, state, and nation. The majority of the respondents in our sample reported they work for pay either full time (41 percent) or part time (11 percent). Compared to five years ago, the number of respondents who report working full or part time has increased and is roughly the same percentage of working respondents reflected in our poll sample ten years ago. However, 7 percent of our respondents reported that they are unemployed, laid off, or looking for work, which reflects a higher percentage than in previous regional outlook polls. [ 5] Compared to respondents who are working or who are unemployed, substantially fewer respondents in the current sample reported they are keeping house, in school, with a job but not at work, or some other category. Roughly 23 percent of the sample reported that they are retired, which is not surprising, as it has been well-documented that a large number of retirees reside in the region, and survey research consistently shows that older people are more likely to respond to surveys than younger people.
Because social science literature has identified hours worked per week and work commute time as significant predictors of important individual wellness factors such as stress, health, job satisfaction, and life satisfaction, we asked working respondents to indicate how many total hours per week they work at all paid jobs and how many minutes on average they spend each day commuting one way to work. Respondents in our sample worked an average of about 41 hours per week (s=13.65) with a minimum of 6 hours worked per week and a maximum of 90 hours worked per week reported. On average, respondents in our sample reported about a 20-minute, one-way commute to work (s=17.22) with a minimum commute of 0 minutes and a maximum commute of 90 minutes. This is less than the state and national average daily one-way commute time of 23 minutes and 25 minutes, respectively. [ 6] We do not find that number of hours worked is significantly related to stress, health, and satisfaction in our sample, however, bivariate analysis indicates that work commute is significantly associated with all three outcomes; as commute time increases, level of stress increases, work satisfaction decreases, and life satisfaction decreases. While these relationships are statistically significant, it should be noted that the relative strength of each relationship is weak.
To find out more about their personal economic and life situation, we also asked respondents
questions about their perceived job stability and satisfaction, when applicable, and
about their income, home ownership status, and financial circumstances. These results
are presented in Figures 2-4 through 2-8. The majority (59 percent) of the working
respondents in our sample said they worry about the possibility of losing their jobs
at least a little (30 percent), to some extent (17 percent), or a great deal (12 percent).
Since 2003, the decline in working respondents who report they do not worry at all
about the possibility of losing their job indicates an increasing trend of perceived
job instability. [ 7] Specifically, compared to the previous two regional outlook surveys, more respondents
are “a little” worried about losing their job. Bivariate analysis indicates that income
is significantly associated with perceived job instability, such that worry about
the possibility of losing one’s job increases as income decreases, although the association
is relatively weak. Interestingly, level of job satisfaction continues to be high;
at roughly the same level as five years ago and somewhat higher than ten years ago.
The majority (90 percent) of working respondents report they are satisfied (49 percent)
or very satisfied (41 percent) with the work they do. 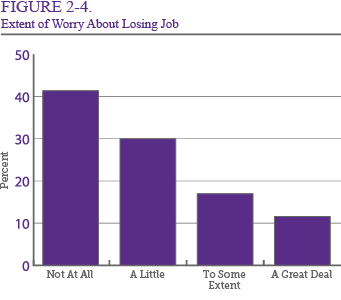
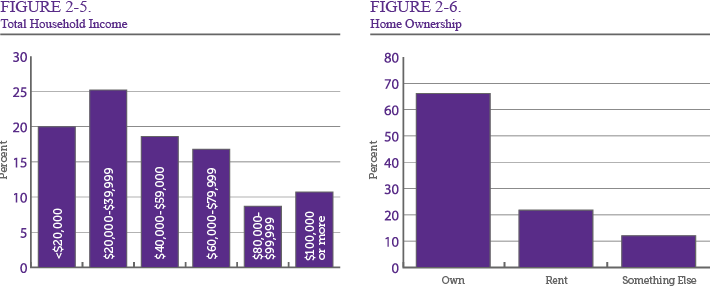
Figure 2-5 presents the distribution of total household income reported by respondents.
The median household income category in our sample is $40,000-$59,000, which suggests
that the current household income of the respondent in the middle of our sample’s
distribution of household income is near to the median household incomes in the state
and the nation. [ 8] While this may appear to be good news, it is important to note that the median household
income at both the state and national level has decreased in recent years to reflect
the most recent economic recession. The most frequently reported category of household
income reported by respondents in our sample is between $20,000 and $39,999 (25 percent),
the same as five years ago. Moreover, compared to five years ago, more respondents
report household incomes of less than $20,000. [9] This indicates that, although household income in WNC may be closer to that in the
state and nation than it was previously, the region’s economic situation has probably
not improved over time with respect to household income and may have even slightly
declined. This finding is replicated in the data regarding residence status (see Figure
2-6). Compared to five years ago, fewer respondents report they own their place of
residence; 66 percent in 2013 compared to 86 percent in 2008. Furthermore, almost
10 percent of respondents in the 2013 sample reported they were living with family
or friends without contributing to rent or mortgage payments.
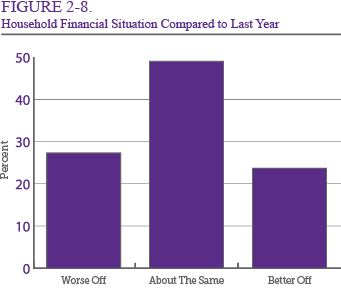
When asked to consider housing close to where they live now that they could afford
(see Figure 2-7), most respondents perceived affordable housing near them to be “good”
(40 percent), followed by “fair” (22 percent) or “very good” (21 percent). This indicates
that the quality of housing in the region is not the primary reason non-home owning
respondents do not own a home. Bivariate analysis of the relationship between home
ownership and perception of quality of affordable housing somewhat supports this for
respondents who rent their place of residence. Renters are more likely to report that
the quality of housing near them is “good,” while respondents who live with family
and friends are more likely to report that the quality of housing near them is just
“fair,” indicating that housing quality may only be an issue for groups who cannot
afford to pay a mortgage or rent. The strength of this relationship is moderately
strong. In our sample, respondents who are younger and fall into lower income groups
are significantly less likely to own their place of residence. 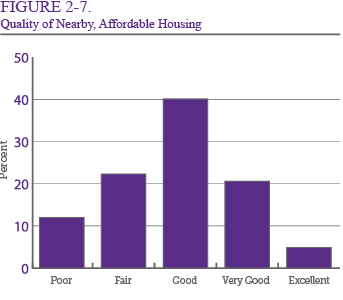
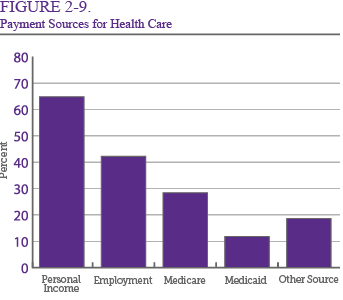
Most (49 percent) respondents view the financial circumstances in their household
as unchanged over the past year (see Figure 2-8), while 27 percent perceive that their
household financial circumstances are worse off and 23 percent perceive their household
financial circumstances are better than a year ago. Continuing to lend support to
a trend of slight economic decline in the region, slightly more respondents view their
household finances as worse off compared to respondents five years ago. In order to
get an idea of respondents’ perceived economic relative deprivation, we also asked
them to compare their household financial circumstances with other households in WNC,
the state, and the nation. For each of the three comparison groups, roughly 40 percent
of respondents report their financial circumstances are “about the same.” However,
they are more likely to see themselves as “better off” compared to other households
in WNC (40 percent) versus the state (27 percent) or the nation (24 percent). Furthermore,
they are more likely to see themselves as “worse off” compared to other households
in the nation (31 percent) versus the state (23 percent) or the region (13 percent).
HEALTH AND HEALTH CARE
Health care is important at the individual, community, and regional levels. In addition to being an important economic stimulator, health care plays a key role in an area’s quality of life. As Chapter 1 of this report makes clear, almost all counties in WNC will see a significant increase in their 65 years and older population because of the aging baby boomer generation and WNC’s retiree population, making individual health care and public health issues increasingly important to the region. For these reasons, we asked respondents a number of questions about their perceptions of health care in the region and their personal health situation.
Around 82 percent of the sample reported having some type of health care coverage; roughly the same percentage who reported having some type of coverage in 2003 and 2008. Bivariate analysis indicates that the odds of having health care coverage are greater for women, whites, older respondents, respondents with higher educational attainment, and respondents who report higher household incomes. As Figure 2-9 suggests, more respondents (65 percent) reported that their health care is paid for by their individual or household income than any other source. Other sources of payment for health care reported by respondents include place of employment (42 percent), Medicare (28 percent), Medicaid (12 percent), or some other source of payment (18 percent). Respondents most frequently cited health insurance plans as other sources of payment for health care. Compared to five years ago, notably more respondents reported they are paying for health care out of pocket (i.e., using their own or household income). [ 10]
Most respondents reported they were satisfied (52 percent) or very satisfied (11 percent) with health care in WNC, while the rest of the sample reported they were unsatisfied (22 percent) or very unsatisfied (12 percent). While level of satisfaction with regional health care is roughly the same as it was five years ago, satisfaction has increased by nearly 10 percent since 2003. Bivariate analysis indicates that the odds of being satisfied with health care coverage are greater for men, whites, and respondents in higher income categories.
To get a better idea regarding the sources of satisfaction and/or dissatisfaction
with health care in WNC, we asked respondents their level of agreement with statements
about the availability, affordability, quality, and variety of health care services
in the area where they live (see Figure 2-10). Most respondents agree (64 percent)
or strongly agree (21 percent) that health care services are available in the area
where they live. Likewise, most respondents agree (66 percent) or strongly agree (13
percent) that there are a variety of health care service options in the area where
they live (18 percent disagree). Furthermore, most respondents agree (60 percent)
or strongly agree (14 percent) that health care services are high quality in the area
where they live (19 percent disagree). However, when it comes to level of agreement
with regard to the affordability of health care services in the area where they live,
there was a clear split in the sample: Almost half of the sample agree (42 percent)
or strongly agree (5 percent) that health care is affordable, but the remaining respondents
disagree (37 percent) or strongly disagree (11 percent) with this statement. Given
the significant increase (from 25 to 65 percent) in the percentage of respondents
who are paying for health care expenses out-of-pocket since the previous regional
outlook poll was conducted five years ago, it is not surprising that more respondents
disagree that health care in the area where they live is affordable. 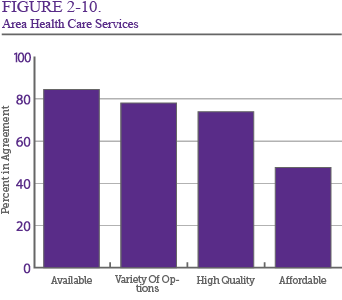
Affordability of health care becomes a prominent issue when individuals experience
high levels of stress that affect their physical, mental, and/or emotional health.
Figure 2-11 presents the distribution of responses to a question asking respondents
to indicate their level of stress over the last six months using a scale of 0 to 10
where 5 represents the amount of stress the average person experiences. Most (53 percent)
respondents in our sample report a higher level of stress (as indicated by a score
of 6 or higher) than that experienced by the average person. The average level of
stress in the sample was indicated by a score of 7 out of 10 (s=2.577), with more
than 10 percent of the sample reporting they experienced “really high stress” (as
indicated by a score of 10 out of 10) in the last six months. Compared to 2008, there
was a 6 percent increase in the percentage of the 2013 sample who reported experiencing
more stress than the average person. Likewise, the average amount of stress reported
has increased by roughly one point on the scale (from a 6 to a 7) since 2008. In spite
of this, most respondents reported having good (50 percent) or excellent (25 percent)
physical health and good (40 percent) or excellent (46 percent) mental health. In
fact, the majority (52 percent) of respondents viewed their physical health as better
than most people their age, whereas only 12 percent viewed their health as worse than
most people their age. Reported social comparisons of mental health are even better,
with the majority of respondents viewing their mental health as better (48 percent)
or about the same (46 percent) as most people their age. Moreover, respondents predominantly
reported being satisfied (49 percent) or very satisfied (36 percent) with their life
at the present time; just slightly less satisfied than in 2008. Bivariate analysis
indicates the odds of being satisfied with one’s life are greater for respondents
with higher education and higher income. 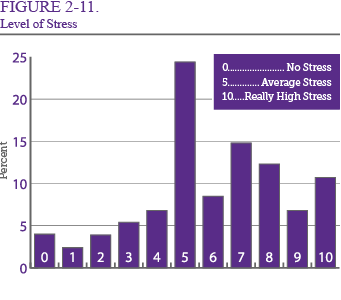
THE COMPLICATED DANCE OF
POLITICAL IDEOLOGY AND PARTISANSHIP IN WNC
In most parts of the United States, political ideology (typically measured on a scale
ranging from extremely liberal to extremely conservative) and political partisanship
(typically measured on a scale ranging from strong Democrat to strong Republican)
are strongly correlated—meaning that strong liberals are likely to be strong Democrats,
strong conservatives are likely to be strong Republicans, and moderates are likely
to be political independents. As seen in Figure 2-12, however, this trend does not
seem to apply to WNC. Whereas 21 percent of our sample self-identify as strong Democrats,
fewer than half of that number (8 percent) self-identify as extremely liberal. Interestingly,
this trend is not true on the other end of the spectrum, as 15 percent of the sample
identify as strong Republicans while 15 percent also consider themselves extremely
conservative. In fact, more than 20 percent of respondents who identify as “extremely
conservative” also identify as a strong Democrat, whereas only 6 percent of “extremely
liberal” respondents identify as a strong Republican. The lesson here is clear: In
WNC, political ideology and partisanship should not be considered as the same concept.
Partisanship in WNC is best considered a “lagging indicator” of a person’s attitudes
about politics and government.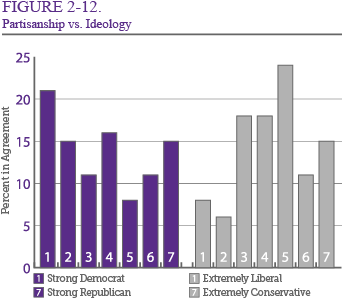
OPINIONS OF INSTITUTIONS
For the next series of questions, we asked respondents about education in the region beginning with three questions asking them to rate their satisfaction with primary education, secondary education, and primary education on a scale from extremely satisfied to extremely unsatisfied.
As Figure 2-13 indicates, respondents believe that education in WNC generally meets
the needs of the region, although opinions about higher education tend to be more
positive than opinions of primary or higher education. This pattern is similar to
what we found in the 2008 study. Unfortunately, although satisfaction is high, education
in the region is not without its perceived problems—only 37 percent of our respondents
agree or strongly agree that higher education in the region is affordable for people
like them.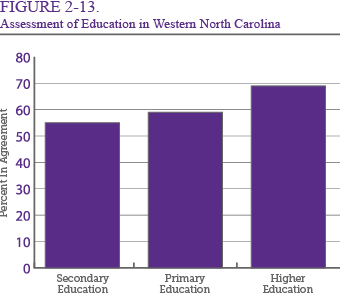
The pattern for opinions of elected officials is considerably less positive. As Figure
2-14 suggests, residents of WNC do not hold their elected officials in very high regard.
We asked respondents to indicate the degree to which they trust the national government,
the state legislature, the governor, and the local government. The governor emerged
as the most trusted, followed by the local government, the state legislature, and
finally the national government—an institution that less than 15 percent of respondents
agree or strongly agree that they trust.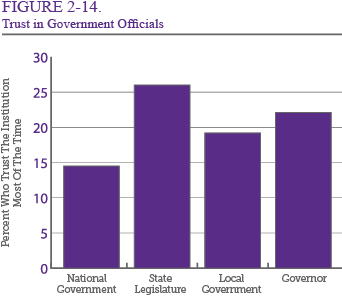
Interestingly, the longer a person lives in WNC, the less likely they are to trust
each of the institutions and political actors previously discussed. Given the partisan
make-up of the White House and the governor’s mansion, it is not surprising that Republicans
and conservatives are more likely to approve of the governor and the state legislature
and less likely to approve of the national and local government. Other factors such
as age, county of residence, and income have no influence on trust in government institutions.
SUMMARY
In all, the survey data paint a picture of a region that is representative of the
country in many ways, but also has a number of unique issues and challenges. Further,
two of the most consistent important predictors of many attitudes and opinions are
county of residence (with Buncombe County residents often demonstrating unique patterns
from the rest of the region) and the percentage of life a person has lived in WNC
(with natives showing distinct patterns from more recent in-migrants). While we
believe these data are important inputs into the policy-making process, they are
not ends to themselves. Instead, policymakers must use the patterns identified within
these data to identify problems that warrant their attention and work with a diverse
set of constituencies to find the appropriate solutions.
2 After putting the contract out for bid, we selected Winthrop University’s Social and Behavioral Research Lab (SBRL) to conduct the calling and implement the survey. The SBRL is a recognized leader in telephone surveys and has over a decade of experience conducting similar surveys. The sample was purchased from Survey Sampling International.
3 http://www.people-press.org/methodology/sampling/cell-phones/ .
4 We round all percentages to the nearest whole number.
5 In 2003 and 2008, 3 and 5 percent of respondents reported being unemployed, l aid off, or looking for work.
6 See http://www.indexmundi.com/facts/united-states/quick-facts/north-carolina/average-commute-time#map for more information on the North Carolina average commute time by county. See http://project.wnyc.org/commute-times-us/embed.html#5.00/42.000/-89.500 for more information on average commute time in the U.S. with additional information about commute time by area.
7 In 2003 and 2008, 49 percent and 62 percent of working respondents said they did not worry at all about the possibility of losing their jobs.
8 Median household income in North Carolina and the U.S. in 2011 were $46,291 and $52,762, respectively. See http://quickfacts.census.gov/qfd/states/37000.html for more information.
9 The percentage of respondents who reported a total household income of less than $20,000 in 2008 and 2013 was 16 and 20 percent, respectively.
10 In 2008, only 25 percent of the sample reported using their own or household income to pay for health care.