- Community & Alumni Engagement
- Community and Economic Engagement
- Public Policy Institute
- Regional Outlook Report
- Chapter 1: Introduction
Chapter 1: Introduction
INTRODUCTION
This report provides a comprehensive overview of Western North Carolina’s (WNC) major demographic, economic, social, and political issues and trends. It is intended to help decision-makers and residents make informed choices about the region based on analysis of up-to-date data in a variety of forms. Although all of the data are new, this third installment of Western Carolina University’s Regional Outlook Report follows the basic structure of our earlier regional outlook reports published in 2004 and 2008. The information provided in these reports is one example of the enactment of WCU’s vision to embrace its responsibilities as a regionally engaged university. [ 1]
The data in this report are taken from three sources: (1) existing federal and state data, (2) aggregate county and regional data, and (3) a public opinion poll of randomly selected respondents in the state’s twenty-three westernmost counties.
DEFINING WESTERN NORTH CAROLINA
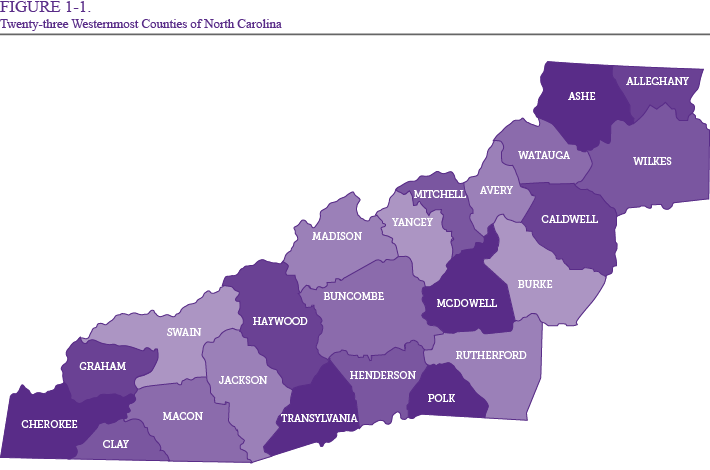
For the purposes of this study, we define Western North Carolina as the twenty-three westernmost counties in the state. This definition mirrors the AdvantageWest economic development region (see Figure 1-1 below) and includes Alleghany, Ashe, Avery, Buncombe, Burke, Caldwell, Cherokee, Clay, Graham, Haywood, Henderson, Jackson, Macon, Madison, McDowell, Mitchell, Polk, Rutherford, Swain, Transylvania, Watauga, Wilkes and Yancey counties. Located in the Blue Ridge/Appalachian Mountains, the western part of the state makes up a distinct topographical region of North Carolina, which is reflected in its unique culture and heritage.
WESTERN NORTH CAROLINA'S CHANGING POPULATION
As shown in Table 1-1, the U.S. Census Bureau 2010 population count for the twenty-three westernmost counties is 1,110,671. The 2010 Census found that the population for the twenty-three counties had grown by more than 107,000 people since 2000, an increase of roughly 11 percent in ten years. While this growth is notable, it reflects a decrease in growth compared to the previous ten-year period, which saw a population increase of roughly 17 percent from 1990-2000. Almost all counties in WNC experienced population growth over the twenty-year period, although Mitchell County experienced a slight loss of population from 2000 to 2010. Much of the population increase in the twenty-three counties over the twenty-year period was the result of migration from other parts of the country to WNC, particularly from 1990-2000.
Over the past twenty years, WNC’s population has grown as a slower rate than the rest
of the state of North Carolina, but at a faster rate than the U.S. as a whole. Population
estimates through the next twenty years indicate growth in the state will continue
to occur at a faster rate than the western part of the state and the country, although
the rate of growth in the country will slightly surpass growth in WNC. However, every
county in WNC is estimated to continue growing through 2030.
|
Table 1-1. Total Population |
||||||
|
Western North Carolina |
NC |
US |
||||
|
Year |
Value |
Percentage Change |
Value |
Percentage Change |
Value |
Percentage Change |
|
1990 |
859,120 |
--- |
6,664,016 |
--- |
249,622,800 |
--- |
|
2000 |
1,003,023 |
16.75% |
8,081,614 |
21.27% |
282,162,400 |
13.04% |
|
2010 |
1,110,671 |
10.73% |
9,560,234 |
18.30% |
309,330,200 |
9.63% |
|
2020 |
1,204,236 |
8.42% |
10,980,840 |
14.86% |
340,554,300 |
10.09% |
|
2030 |
1,310,910 |
8.86% |
12,483,290 |
13.68% |
373,751,000 |
9.75% |
* 2020 and 2030 values are estimates
* Sources: U.S. Census Bureau, Woods and Poole 2012
Overall aggregate statistics provide a valuable general view of the changing nature
of the region, but the trends of key demographic characteristics can provide a more
comprehensive understanding of the changing economic, social, and political needs
in the region that further aid in effective policy decision-making. Regional demographic
characteristics of interest include sex, race and ethnicity, age, and marital status.
Using census data over a forty-year period starting in 1990 and ending in 2030, we
were able to identify several notable changes in the demographic structure of WNC
as a whole.
Sex
As a region, the distribution of sex follows the distribution typical at the state and national levels of analysis; there are more women than men at any given point in time (see Table 1-2). This trend is demonstrated across the individual counties in WNC, with the exception of Avery County, where population data reflect more men than women with an increase in this gap over time. However, the degree of difference between the number of women and men in the region as a whole depends on the year of data collection; the data indicate a decrease in the difference over time from roughly 7 percent more women in 1990 to around 4 percent more women in 2010. Population estimates over the next twenty years indicate this difference will continue to stabilize around a difference of 4 percent more women than men through 2030. The distribution of sex at the state and national levels follow the same general trend in which the gap between the number of women and men in the population decreases over time, stabilizing by the year 2030. However, the decrease at the state and national levels is not as pronounced as that at the regional level.
|
Table 1-2. Total Population by Sex |
|||||||
|
Western North Carolina |
NC |
US |
|||||
|
Year |
Sex |
Value |
Percentage Change |
Value |
Percentage Change |
Value |
Percentage Change |
|
1990 |
Male |
415,195 |
--- |
3,232,161 |
--- |
121,713,800 |
--- |
|
Female |
443,925 |
--- |
3,431,855 |
--- |
127,909,100 |
--- |
|
|
2000 |
Male |
490,058 |
18.03% |
3,962,580 |
22.60% |
138,443,400 |
13.75% |
|
Female |
512,965 |
15.55% |
4,119,034 |
20.02% |
143,719,000 |
12.36% |
|
|
2010 |
Male |
544,178 |
11.04% |
4,660,293 |
17.61% |
152,096,300 |
9.86% |
|
Female |
566,493 |
10.44% |
4,899,941 |
18.96% |
157,233,900 |
9.40% |
|
|
2020 |
Male |
589,784 |
8.38% |
5,351,924 |
14.84% |
167,717,400 |
10.27% |
|
Female |
614,452 |
8.47% |
5,628,918 |
14.88% |
172,836,900 |
9.92% |
|
|
2030 |
Male |
641,380 |
8.75% |
6,090,973 |
13.81% |
183,903,100 |
9.65% |
|
Female |
669,530 |
8.96% |
6,392,320 |
13.56% |
189,847,900 |
9.84% |
|
* 2020 and 2030 values are estimates
* Sources: U.S. Census Bureau, Woods and Poole 2012
Race and Ethnicity
Since 1990, the size of all race and ethnicity minority populations in WNC has grown (see Table 1-3). This trend is particularly evident during the time period between 1990 and 2000 when the Hispanic/Latino and Asian American/Pacific Islander populations grew by roughly 410 percent and 169 percent, respectively. The estimated growth in these groups is expected to continue at an accelerated rate compared to other minority groups in WNC, albeit at a somewhat slower pace than during the 1990-2000 time period.
Prior to 2010, blacks were the largest minority group in WNC and Asian Americans/Pacific Islanders were the smallest minority group. As of 2010, Hispanics/Latinos are the largest minority in WNC, followed by blacks. The Native American and Asian American/Pacific Islander populations in WNC are currently about the same size. However, the Asian American/Pacific Islander population is estimated to surpass the Native American population by roughly 65 percent over the next twenty years.
The growth of the Hispanic/Latino population in WNC reflects roughly the same rate of growth as that in the state. However, the rate of growth of the Hispanic/Latino population in WNC and the state is markedly larger compared to the nation, particularly during the time period between 1990 and 2010. Between 1990 and 2000, a similar growth trend for WNC and the state is found for Asian Americans/Pacific Islanders, but in 2000 the rate of growth in the WNC Asian American/Pacific Islander population slows to a similar rate as the nation and continues that trend through 2030. Of additional note is the slow rate of growth in the black population in WNC during the 1990-2010 time period compared to the growth of the black population in the state and country. After 2010, the growth of the black population in the state and particularly the nation slows to a similar rate as that in WNC. Alternately, the rate of growth of the Native American population in the region, state, and nation is roughly the same from 1990-2010 but after that time the growth rate in the region decreases at a larger rate compared to the state and the nation.
By 2010, Hispanics/Latinos were the largest minority group in all counties in WNC except Buncombe, Burke, Caldwell, Jackson, Rutherford, Swain, and Transylvania counties. In Buncombe, Burke, Caldwell, Rutherford, and Transylvania counties, blacks were the largest minority group. While blacks are estimated to remain the largest minority group in Rutherford and Transylvania counties through 2030, by 2020 blacks are estimated to become the second largest minority group after Hispanics/Latinos in Buncombe, Burke, and Caldwell counties. In Jackson and Swain counties, Native Americans are the largest minority group. They are estimated to remain the largest minority group in those counties through 2030.
|
Table 1-3. Total Population by Race/Ethnicity |
|||||||
|
Western North Carolina |
NC |
US |
|||||
|
Year |
Race/ Ethnicity |
Value |
Percentage Change |
Value |
Percentage Change |
Value |
Percentage Change |
|
1990 |
White |
799,933 |
--- |
4,996,262 |
--- |
188,712,100 |
--- |
|
Black |
42,556 |
--- |
1,459,080 |
--- |
29,422,680 |
--- |
|
|
Native Am. |
8,278 |
--- |
79,533 |
--- |
1,804,565 |
--- |
|
|
As.Am./Pac.Is. |
3,041 |
--- |
51,638 |
--- |
7,096,290 |
--- |
|
|
Hispanic/Latino |
5,312 |
--- |
77,503 |
--- |
22,587,210 |
--- |
|
|
2000 |
White |
909,371 |
13.68% |
5,710,371 |
14.29% |
197,421,700 |
4.62% |
|
Black |
47,636 |
11.94% |
1,759,120 |
20.56% |
35,204,980 |
19.65% |
|
|
Native Am. |
10,792 |
30.37% |
99,853 |
25.55% |
2,336,232 |
29.46% |
|
|
As.Am./Pac.Is. |
8,160 |
168.33% |
127,061 |
146.06% |
11,541,140 |
62.64% |
|
|
Hispanic/Latino |
27,064 |
409.49% |
385,209 |
397.02% |
35,658,330 |
57.87% |
|
|
2010 |
White |
978,191 |
7.57% |
6,319,064 |
10.66% |
200,135,200 |
1.37% |
|
Black |
50,597 |
6.22% |
2,090,361 |
18.83% |
39,547,880 |
12.34% |
|
|
Native Am. |
11,775 |
9.11% |
115,855 |
16.03% |
2,573,394 |
10.15% |
|
|
As.Am./Pac.Is. |
11,511 |
41.07% |
229,160 |
80.35% |
16,287,540 |
41.13% |
|
|
Hispanic/Latino |
58,597 |
116.51% |
805,794 |
109.18% |
50,786,230 |
42.43% |
|
|
2020 |
White |
1,034,547 |
5.76% |
6,857,671 |
8.52% |
205,458,300 |
2.66% |
|
Black |
56,253 |
11.18% |
2,445,990 |
17.01% |
43,772,950 |
10.68% |
|
|
Native Am. |
12,707 |
7.92% |
133,564 |
15.29% |
2,902,449 |
12.79% |
|
|
As.Am./Pac.Is. |
15,708 |
36.46% |
347,338 |
51.57% |
21,070,020 |
29.36% |
|
|
Hispanic/Latino |
85,021 |
45.09% |
1,196,279 |
48.46% |
67,350,610 |
32.62% |
|
|
2030 |
White |
1,091,415 |
5.50% |
7,242,444 |
5.61% |
208,813,900 |
1.63% |
|
Black |
61,879 |
10.00% |
2,784,145 |
13.82% |
47,932,500 |
9.50% |
|
|
Native Am. |
13,498 |
6.22% |
147,386 |
10.35% |
3,190,989 |
9.94% |
|
|
As.Am./Pac.Is. |
20,890 |
32.99% |
510,944 |
47.10% |
26,625,470 |
26.37% |
|
|
Hispanic/Latino |
123,228 |
44.94% |
1,798,374 |
50.33% |
87,188,190 |
29.45% |
|
* White, Black, Native American, and Asian American / Pacific Islander categories
are composed of non-Hispanic individuals only. The Hispanic / Latino category includes
individuals of any race.
* 2020 and 2030 values are estimates
* Sources: U.S. Census Bureau, Woods and Poole 2012
Age
From 1990 to 2000, the WNC population for all groups 40 years of age or older exhibited a significantly larger increase than that in the population under 40 years of age, a trend that is also demonstrated at state and national levels (see Table 1-4). The sustained rate of growth in these age groups at the state level through 2020 indicates that the growth rate has increased net of the natural increase in the aging population, suggesting the increase in older age groups is at least partially due to the in-migration of persons from these age groups into the state for employment or retirement reasons. Compared to the national level, the regional pattern of growth in the 65 years and older population demonstrated during the 1990-2010 time period suggests that the increase in this age group in WNC is at least partially due to retirement in-migration. However, estimated data through 2030 indicates that the significant influx of retirees to the region could slow somewhat, although the regional decrease in the 65-years-and-older age group represented at the 2030 data point is certainly influenced by the decrease in the birth rate of the 1970-1980 birth cohort, which is represented across time at all levels of data collection. Nonetheless, almost all counties in WNC will see an increase of around double in the 65-years-and-older age group over the forty-year time period in consideration. Exceptions include Henderson, Transylvania, and Watauga counties, whose 65-years-and-older age groups are estimated to roughly triple since 1990. Moreover, in all counties but Burke, Jackson, Swain, and Watauga, the 65-years-and-older age group will become the largest age group in the county by 2030. In these counties, those aged 19 years and younger (Burke, Jackson, and Swain counties) or those aged 20-29 (Watauga County) will become the largest age group in the county by 2030.
|
Table 1-4. Total Population by Age |
|||||||
|
Western North Carolina |
NC |
US |
|||||
|
Year |
Age |
Value |
Percentage Change |
Value |
Percentage Change |
Value |
Percentage Change |
|
1990 |
< 20 years |
220.216 |
--- |
1854.691 |
--- |
71917.67 |
--- |
|
20-29 years |
124.55 |
--- |
1131.896 |
--- |
40427.43 |
--- |
|
|
30-39 years |
128.105 |
--- |
1102.462 |
--- |
41929.07 |
--- |
|
|
40-49 years |
115.596 |
--- |
864.867 |
--- |
31621.96 |
--- |
|
|
50-64 years |
133.021 |
--- |
903.683 |
--- |
32479.4 |
--- |
|
|
65 + years |
137.632 |
--- |
806.417 |
--- |
31247.28 |
--- |
|
|
2000 |
< 20 years |
243.558 |
10.60% |
2196.52 |
18.43% |
80574.8 |
12.04% |
|
20-29 years |
125.811 |
1.01% |
1185.135 |
4.70% |
38396.93 |
-5.02% |
|
|
30-39 years |
139.115 |
8.59% |
1267.841 |
15.00% |
43175.09 |
2.97% |
|
|
40-49 years |
147.692 |
27.77% |
1209.514 |
39.85% |
42737.52 |
35.15% |
|
|
50-64 years |
182.17 |
36.95% |
1250.117 |
38.34% |
42208.51 |
29.96% |
|
|
65 + years |
164.677 |
19.65% |
972.487 |
20.59% |
35069.57 |
12.23% |
|
|
2010 |
< 20 years |
256.991 |
5.52% |
2555.337 |
16.34% |
83185.59 |
3.24% |
|
20-29 years |
131.628 |
4.62% |
1297.656 |
9.49% |
42849.18 |
11.60% |
|
|
30-39 years |
129.967 |
-6.58% |
1280.686 |
1.01% |
40147.7 |
-7.01% |
|
|
40-49 years |
150.57 |
1.95% |
1364.059 |
12.78% |
43538.25 |
1.87% |
|
|
50-64 years |
239.436 |
31.44% |
1820.001 |
45.59% |
59132.2 |
40.10% |
|
|
65 + years |
202.079 |
22.71% |
1242.495 |
27.76% |
40477.3 |
15.42% |
|
|
2020 |
< 20 years |
271.457 |
5.63% |
2911.222 |
13.93% |
89111.49 |
7.12% |
|
20-29 years |
136.873 |
3.98% |
1448.129 |
11.60% |
44979.53 |
4.97% |
|
|
30-39 years |
135.18 |
4.01% |
1407.803 |
9.93% |
44864.83 |
11.75% |
|
|
40-49 years |
140.294 |
-6.82% |
1359.816 |
-0.31% |
41501.21 |
-4.68% |
|
|
50-64 years |
247.229 |
3.25% |
2085.601 |
14.59% |
64815.68 |
9.61% |
|
|
65 + years |
273.203 |
35.20% |
1768.271 |
42.32% |
55281.59 |
36.57% |
|
|
2030 |
< 20 years |
292.714 |
7.83% |
3241.018 |
11.33% |
96242.75 |
8.00% |
|
20-29 years |
150.273 |
9.79% |
1735.679 |
19.86% |
48725.25 |
8.33% |
|
|
30-39 years |
143.883 |
6.44% |
1581.901 |
12.37% |
46812.4 |
4.34% |
|
|
40-49 years |
150.3 |
7.13% |
1500.537 |
10.35% |
46828.84 |
12.84% |
|
|
50-64 years |
235.559 |
-4.72% |
2090.123 |
0.22% |
62333.83 |
-3.83% |
|
|
65 + years |
338.181 |
23.78% |
2334.035 |
32.00% |
72807.97 |
31.70% |
|
* Values in thousands
* 2020 and 2030 values are estimates
* Sources: U.S. Census Bureau, Woods and Poole 2012
Marital Status
Since 1990, the growth rate in the unmarried category has remained relatively consistent in WNC, the state, and the country (see Table 1-5). During the 1990-2000 time period, the growth rate in the married population in WNC and the state was notably higher compared to the nation, but the following ten-year time period indicates a decrease in the growth of the married population in WNC to a rate closer to that in the nation. These findings undoubtedly reflect increasing trends in the delay of age of first marriage, in the decision to never marry, and in the decision to divorce. Nonetheless, all counties demonstrate an increase in the married population over the time period in question except Burke and Swain counties, which each demonstrate decreases in the size of the married population between 2000 and 2010.
|
Table 1-5. Population by Marital Status |
|||||||
|
Western North Carolina |
NC |
US |
|||||
|
Year |
Marital Status |
Value |
Percentage Change |
Value |
Percentage Change |
Value |
Percentage Change |
|
1990 |
Married |
422,529 |
--- |
3,014,116 |
--- |
111,499,000 |
--- |
|
Unmarried |
278,643 |
--- |
8,151,234 |
--- |
83,643,000 |
--- |
|
|
2000 |
Married |
490,747 |
16.15% |
3,596,838 |
19.33% |
120,083,729 |
7.70% |
|
Unmarried |
329,740 |
18.34% |
9,938,782 |
21.93% |
101,064,942 |
20.83% |
|
|
2010 |
Married |
521,388 |
6.24% |
4,044,880 |
12.46% |
124,183,000 |
3.41% |
|
Unmarried |
404,259 |
22.60% |
11,934,790 |
20.08% |
117,864,000 |
16.62% |
|
* Data represents population aged 15 years and older
* Married category includes persons with spouse present and spouse absent
* Unmarried category includes widowed, divorced, and never married
* Estimates for 2020 and 2030 were not available at the time of data analysis
* Sources: U.S. Census Bureau, Log Into North Carolina (LINC)
SUMMARY
The changing nature of WNC’s population calls for policies that address the unique demographic trends in the region and suggests that policies that work at the state and national levels may not be appropriate to apply at the regional level. Taken into consideration with the public opinion data and economic data presented in the following chapters, we hope that the information presented in this report is useful to policymakers and interested citizens in the region.
In subsequent chapters, we discuss our findings regarding social, political, and economic issues in WNC. The following two chapters will review the first major social and political findings of the regional outlook poll that was conducted during the summer of 2013 and then provide an economic analysis of the region.
1 See strategicplan.wcu.edu for more information about WCU’s 2020 Strategic Vision: Focusing on the Future.